Grafana series (XIII): How to view Kubernetes Events with Loki collections
This article was last updated on: July 24, 2024 am
Synopsis
- IoT edge clusters are implemented based on alarm notifications from Kubernetes Events
- IoT edge cluster Alarm notification implementation based on Kubernetes Events (2): Further configuration
overview
Kubernetes Events is super useful when analyzing K8S cluster issues.
Kubernetes Events can be treated as logs in a similar format to logs, including:
- Time
- subassembly
- cause
- …
However, Kubernetes only persists events for one hour by default to reduce the load on etcd. So, consider using Loki to store and query these Events.
implement
Looked My previous article You can know,kubernetes-event-exporter You can implement the collection of Kubernetes Events.
So let’s use kubernetes-event-exporter, through the easiest stdout way to output event.
Also, reuse Promtail’s Pipeline configurationto add NameSpace as an additional tag to the logs exported to Loki.
kubernetes-event-exporter configuration
As follows:
1 | |
Promtail configuration
As follows:
1 | |
The above configuration will be taken from Events’ JSONPath involvedObject.namespace Get NameSpace and use it as a label - namespace Add to.
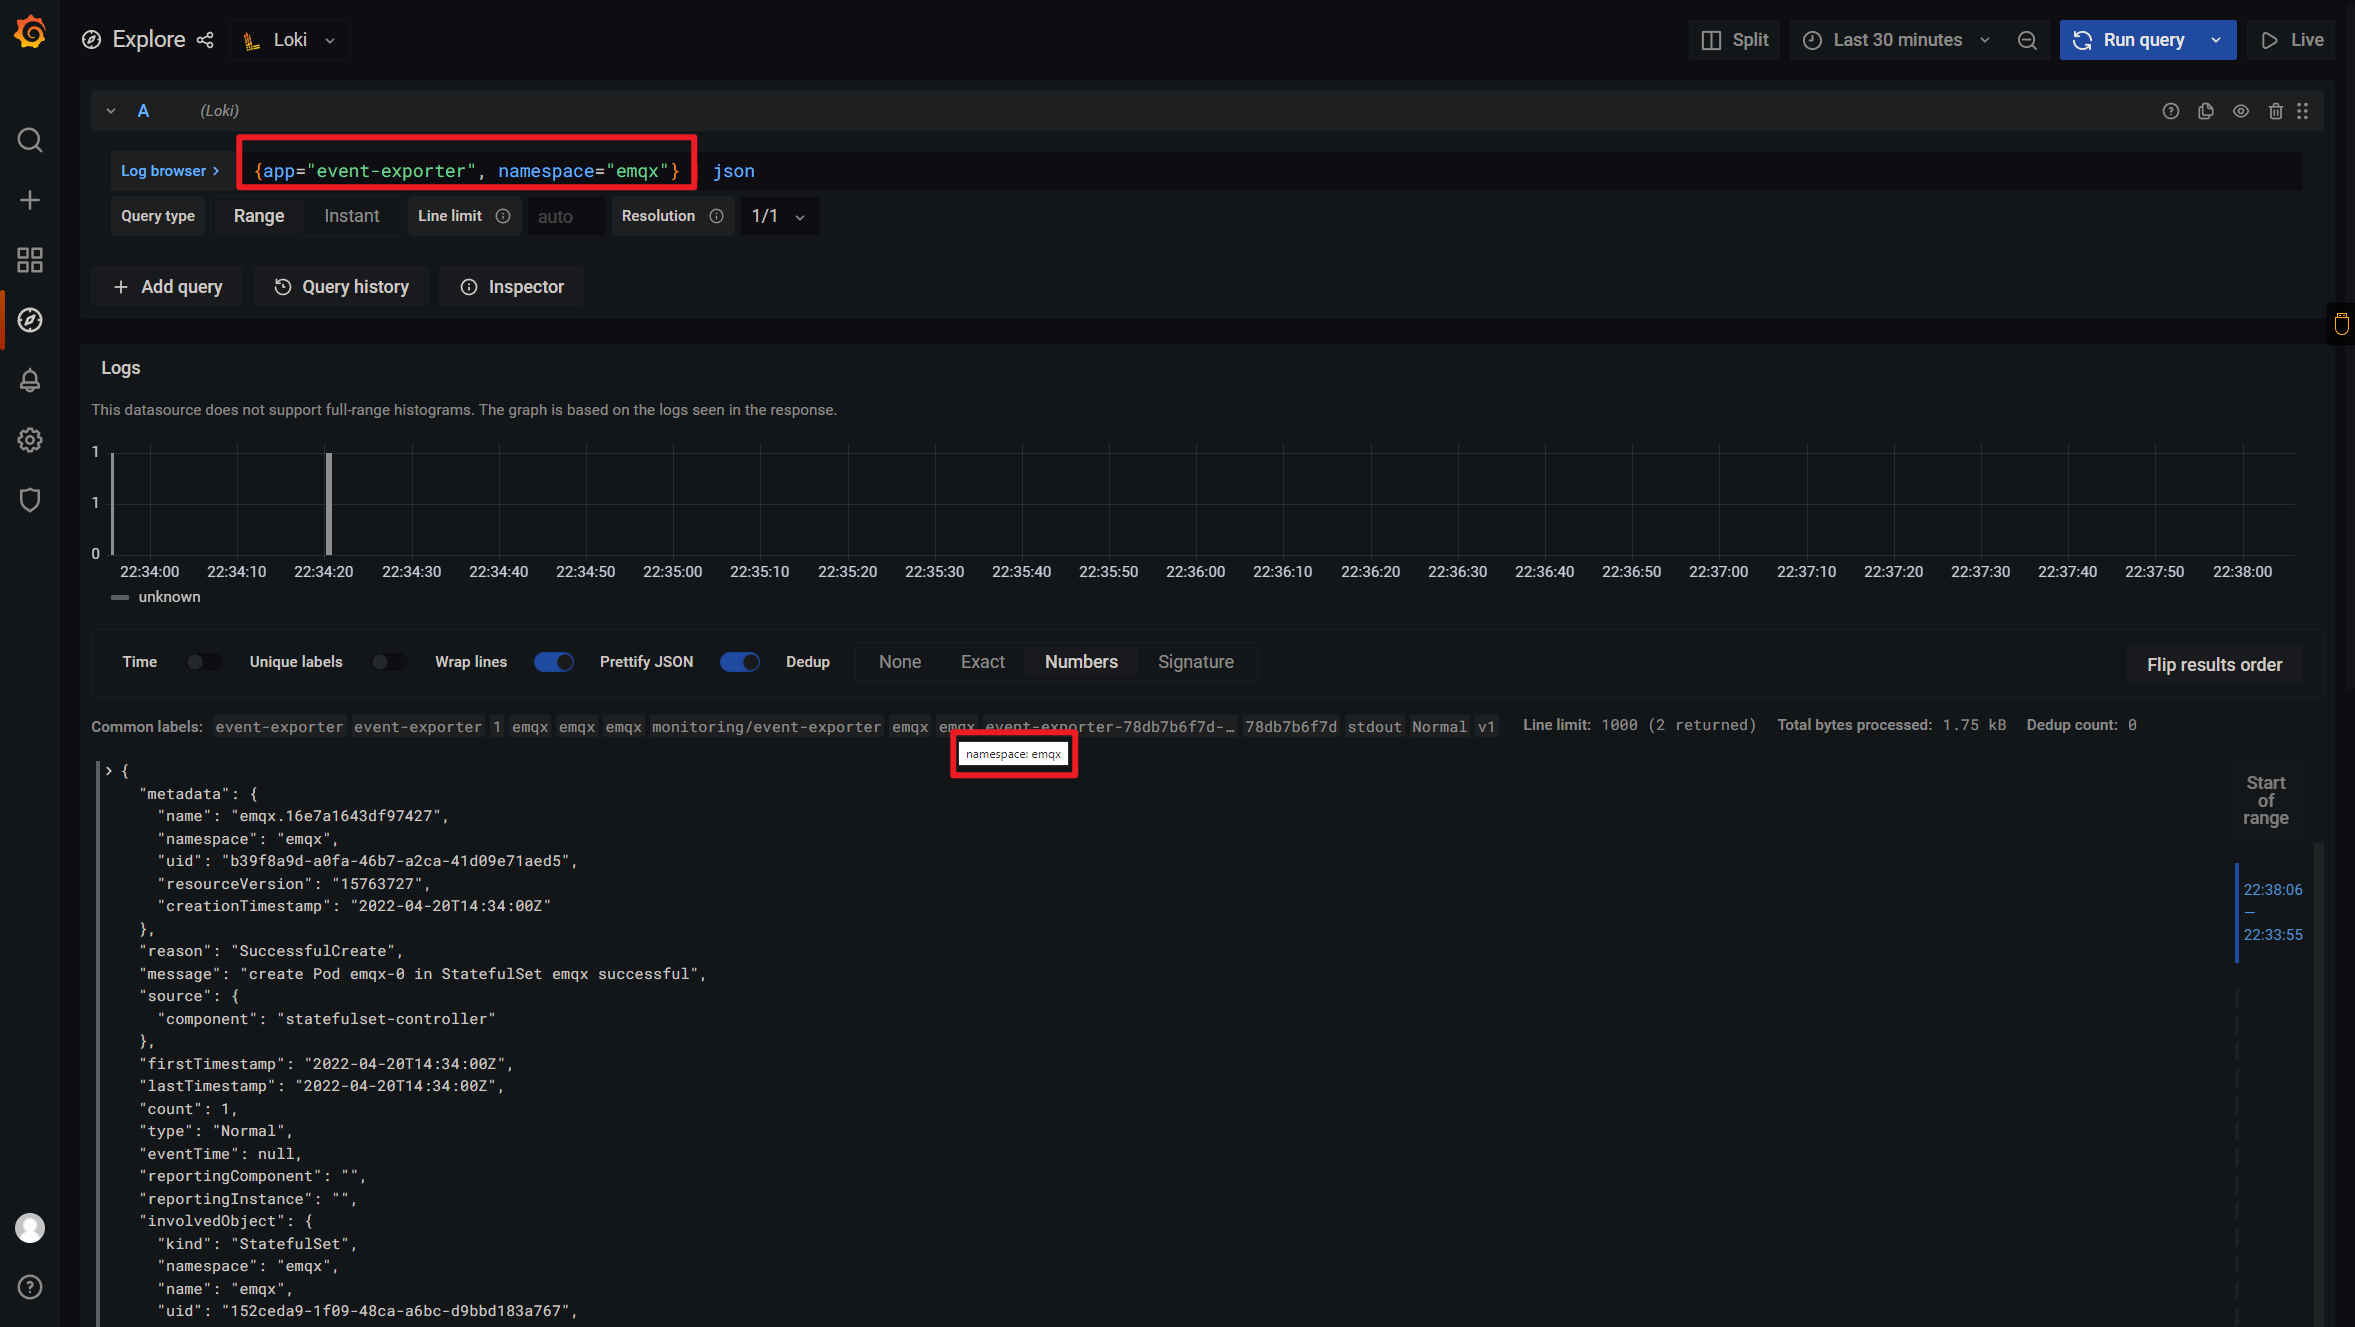
At this point, I can only view specific NameSpaces (such asemqxEvents, as shown below:

🎉🎉🎉
📝Notes:
It’s mine
event-exporterYes deployed inmonitoringNS
❓️ Troubleshooting
When I first started doing it, I found that the log output was incorrect, and the format example is as follows:

1 | |
This is because the container runtime I use is CRI, not Docker.
However, when Loki is installed by default, Docker’s stage parser is used in the configuration file, resulting in an abnormal log format. The initial configuration is as follows:
1 | |
Docker’s log format is as follows:
1 | |
The log format for CRI is as follows:
1 | |
So as shown above, choose the appropriate stage parser according to your container runtime.
For CRI, cri: {} In fact, it is a “grammatical sugar” with the following details:
1 | |
📚️ Reference documentation
- How Grafana Labs Effectively Pairs Loki and Kubernetes Events | Grafana Labs
- Configuration | Grafana Labs
- What is the correct way to parse json logs in loki, promtail - Grafana Loki - Grafana Labs Community Forums