Grafana Series (I): A full-stack observability demo based on Grafana
This article was last updated on: February 7, 2024 pm
📚️Reference:
This is a companion library of talks on the three pillars of observability in Grafana.
It comes in the form of a self-enclosed Docker sandbox that includes all the components needed to run and experiment with the services provided on your local machine.
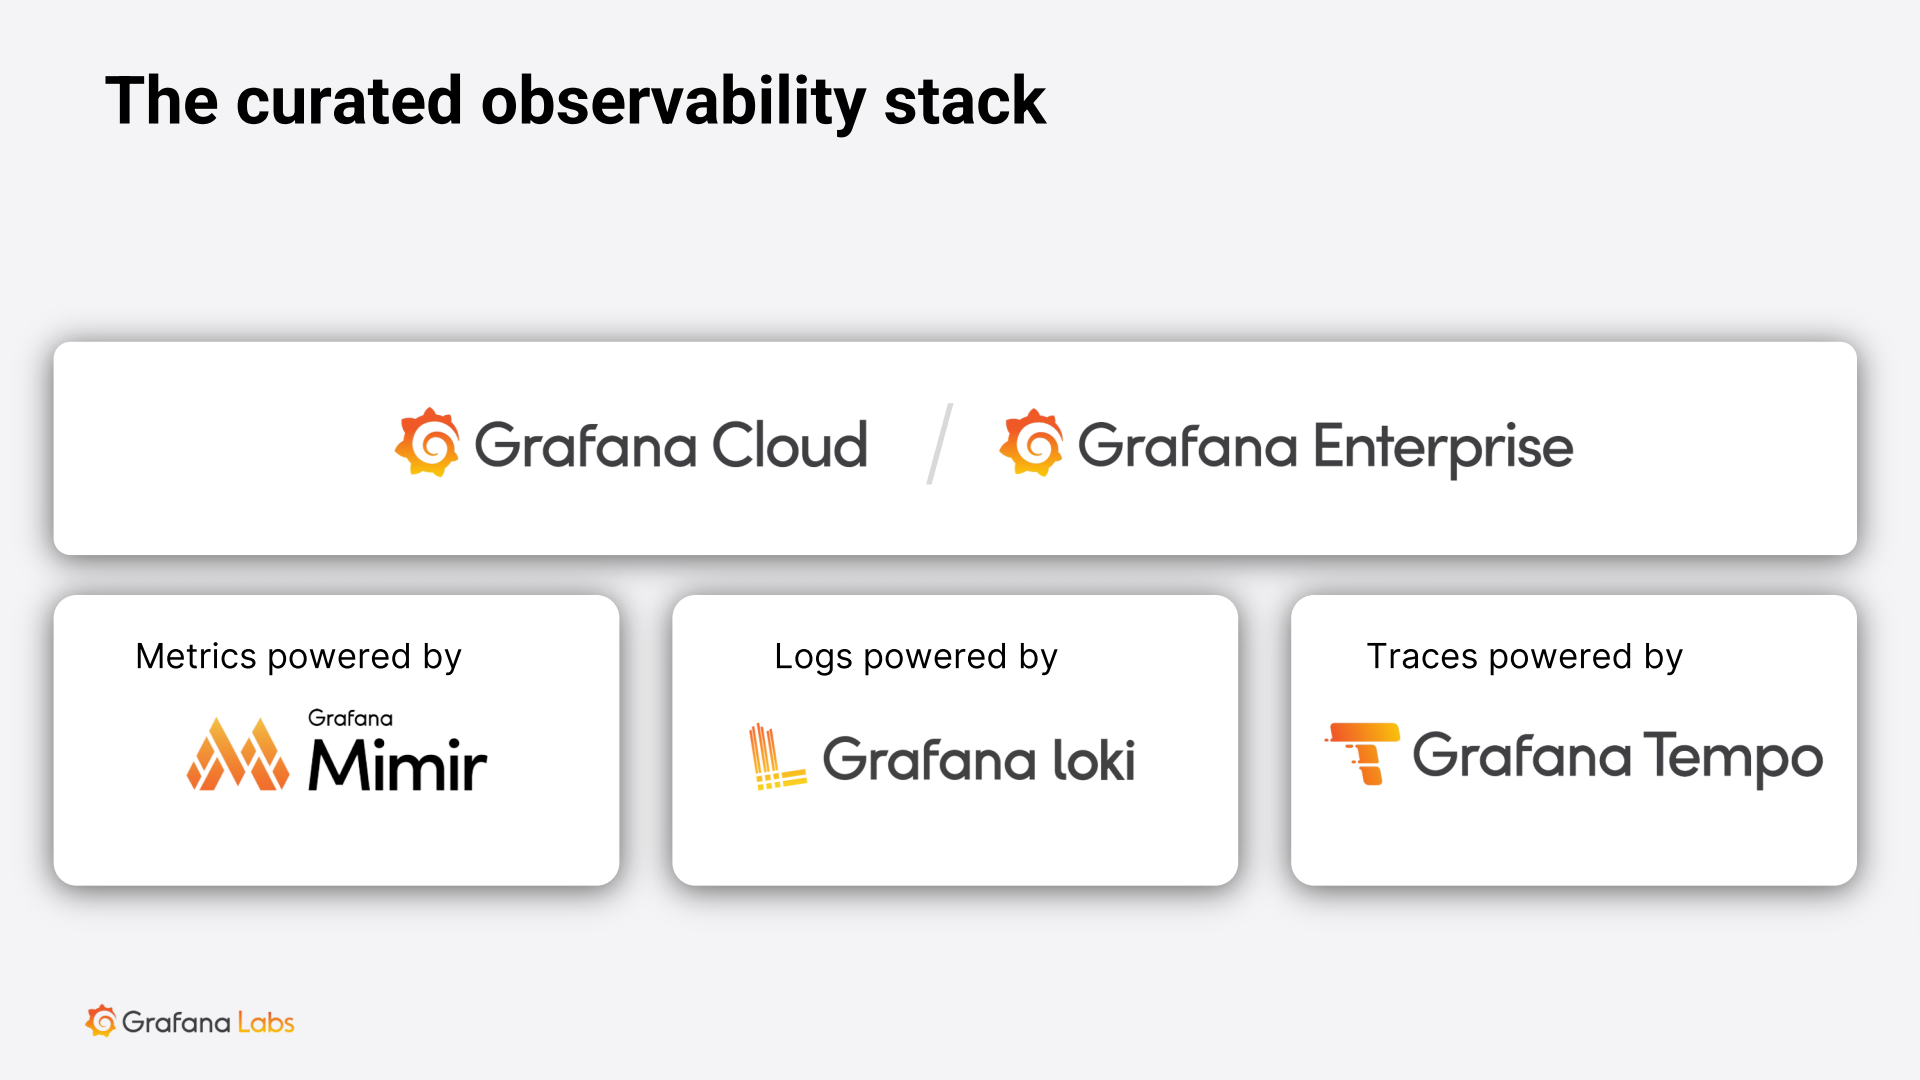
Grafana full-stack observability products
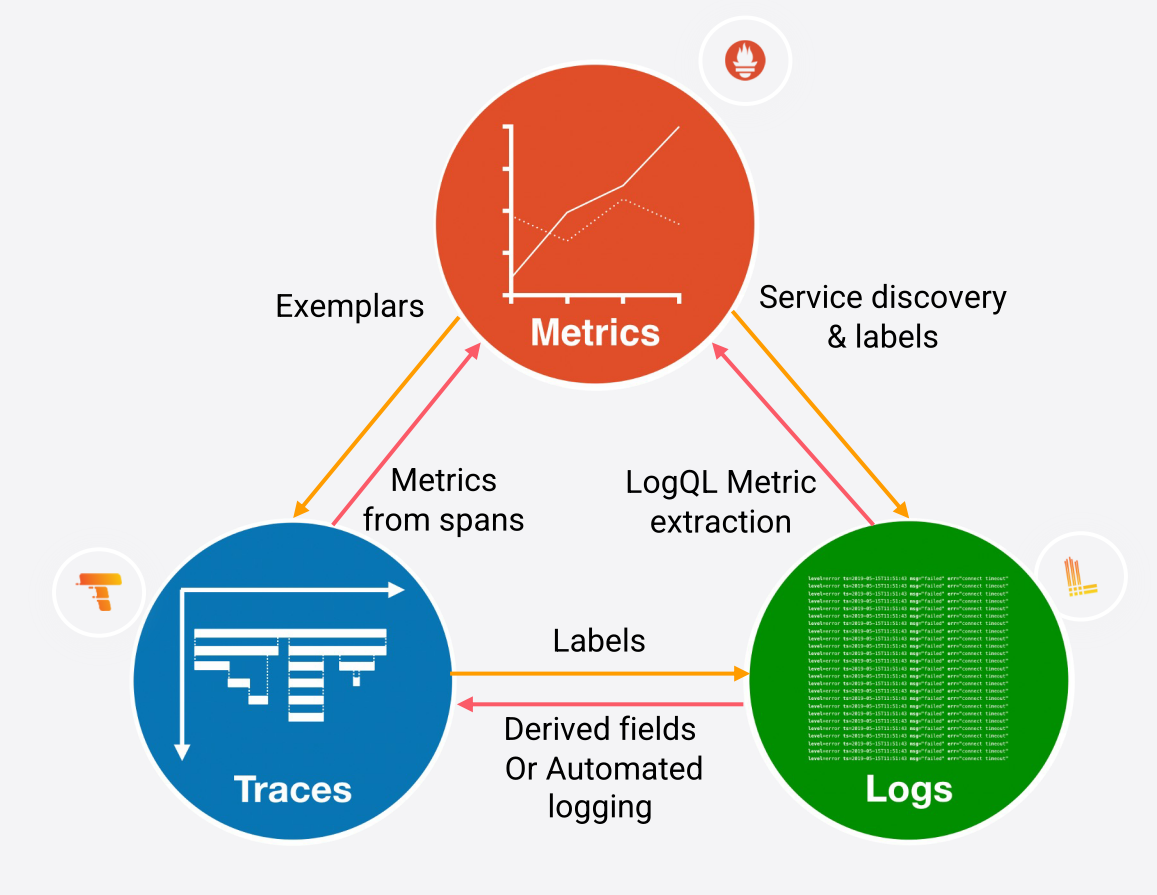
Concrete observability conversion diagram
precondition
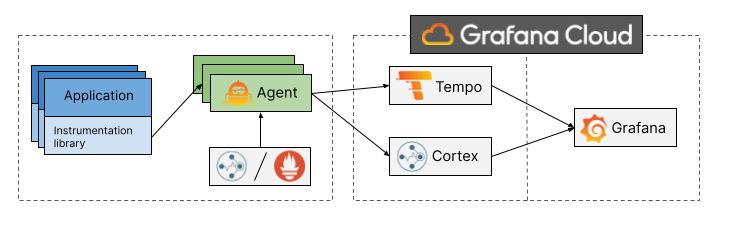
overview
This series of demos is based on the applications and code in this library, including:
- Docker Compose manifest for easy setup.
- Applications of three services:
- A service that requests data from a REST API server.
- A REST API server that receives requests and leverages a database to store/retrieve data for those requests.
- A Postgres database for storing/retrieving data.
- Tempo instances are used to store trace information.
- A Loki instance to store log information.
- An instance of Prometheus, which stores metrics information.
- A Grafana instance to visualize observability information.
- An instance of Grafana Agent that receives traces and generates metrics and logs based on those traces.
- A Node Exporter instance that retrieves resource metrics from localhost.
Run the demo environment
Docker Compose downloads the required Docker image and then launches the demo environment. Data will be emitted from microservices applications and stored in Loki, Tempo, and Prometheus. You can log in to your Grafana instance to visualize this data. To execute the environment and log in.
-
Launch a new command line interface in your operating system and run:
1
docker-compose up -
Log in to your local Grafana instance at:http://localhost:3000/ Note: This assumes that port 3000 is not already in use. If this port is not available, edit it
docker-compose.ymlfile, and modify this line1
- "3000:3000"To some other free host port, for example:
1
- "3123:3000" -
visit MLT dashboard. (MLT: Metrics/Logging/Tracing)
-
use Grafana Explorer Access the data source.
🐾 Note:
For users in China, you can do so on demand
buildAdd proxy, as follows:
2
3
4
5
6
7
8
9
10
11
12
13
14
15
16
17
18
19
20
21
22
23
24
25mythical-requester:
build:
context: ./source
dockerfile: docker/Dockerfile
args:
HTTP_PROXY: http://192.168.2.9:7890
HTTPS_PROXY: http://192.168.2.9:7890
SERVICE: mythical-beasts-requester
mythical-server:
build:
context: ./source
dockerfile: docker/Dockerfile
args:
HTTP_PROXY: http://192.168.2.9:7890
HTTPS_PROXY: http://192.168.2.9:7890
SERVICE: mythical-beasts-server
prometheus:
build:
context: ./prometheus
args:
HTTP_PROXY: http://192.168.2.9:7890
HTTPS_PROXY: http://192.168.2.9:7890
Grafana
Grafana is a visualization tool that allows you to create dashboards from a variety of data sources. More information can be found here Found it。
The Grafana instance is indocker-compose.ymlThe Grafana section of the manifest is described.
1 | |
It:
- Mount two repository directories to provide a prebuilt data source for the data (
./grafana/provisioning/datasources.yaml)。 - Prebuilt dashboards to correlate metrics, logs, and traces. (
./grafana/definitions/mlt.yaml) - Provided for local login
3000Port. - Enable two Tempo features, span search and service graph support.
No custom configuration is used.
📚️ Reference:
Grafana Agent|Grafana Laboratory (grafana.com)
- “It’s often used as a trace pipeline to offload traces from applications and forward them to the storage backend. The Grafana Agent trace stack is built using OpenTelemetry.”
- “Grafana Agent supports receiving traces in multiple formats: OTLP (OpenTelemetry), Jaeger, Zipkin, and OpenCensus.”
Generate metrics from spans - Grafana Laboratory (grafana.com)
Prometheus
Prometheus is a back-end storage and service for scraping (pulling) metric data from a variety of sources. More information can be found at Over here Found it. In addition, Mimir is a long-term retention store of Prometheus data, and information about it can be found at Over here Found it.
The Prometheus instance is indocker-compose.ymlof the listprometheussection is described.
1 | |
It is made ofprometheusA modified Dockerfile build in the directory. This copies the configuration file to the new image and enables some features by modifying the command string used at startup (including Exemplar support - "--enable-feature=exemplar-storage")。 Prometheus exposes its primary interface on port 9090.
1 | |
Configuration file (prometheus/prometheus.ymlSeveral scrape jobs are defined, including:
-
Retrieve metrics from the Prometheus instance itself. (
job_name: 'prometheus') -
Get metrics from microservices apps. (
job_name: 'mythical-server'andjob_name: 'mythical-requester') -
Metrics from installed instances of Node Exporter. (
job_name: 'node') -
Metrics from the Grafana Agent, derived from incoming trace data. (
job_name: 'span-metrics')
📚️References:
Exemplars storage | Prometheus Docs
- 「OpenMetrics The ability to scrape targets has been introduced to add examples (Exemplars) to specific metrics.A paradigm is a reference to data outside the set of measures. A common use case is the ID of a program trace.」
Loki
Loki is a back-end store for long-term log retention. More information can be found at Over here Found it.
The Loki instance is indocker-compose.ymlof the listlokisection is described.
1 | |
This instance is only availablelatest loki mirror, and in3100The port exposes its interface.
Microservices applications send their logs directly to Loki instances in that environment through their REST APIs.
Tempo
Tempo is a back-end store for long-term retention of traces. More information can be found at Over here Found it.
The Tempo instance is indocker-compose.ymlof the listtemposection is described.
The Tempo service imports a configuration file (tempo/tempo.yaml), the file initializes the service with some reasonable defaults and allows receiving traces in a variety of different formats.
1 | |
1 | |
Grafana Agent
Grafana Agent is a locally installed agent that acts as:
- Prometheus scraping services.
- Tempo backend service receiver and trace span processor.
- A Promtail (Loki log sink) instance.
The Grafana Agent has remote write capabilities, allowing it to send metrics, logs, and trace data to back-end storage such as Mimir, Loki, and Tempo. More information about the Grafana Agent can be found at Over here Found it.
Its main role in this environment is to receive trace spans from microservices applications and process them to extract metrics and log information, and then store them to the final back-end storage.
Its configuration file can be found inagent/config.yamlfound.
1 | |
1 | |
glossary
| English | Chinese | Notes |
|---|---|---|
| Exemplars | Example | |
| Derived fields | Derived field | |
| Metrics | Measure | |
| Logging | Log | |
| Tracing | Trace | |
| observability | Observability | |
| span search | Span Search | Tempo function - requires Grafana Agent |
| service graph | Service graph support | Tempo function - requires Grafana Agent |
| scrape | Scraping | Prometheus vocabulary |