Case 2: Analysis of GC overhead overrun problem in the core system of a life insurance company
This article was last updated on: February 7, 2024 pm
overview
The core system of a life insurance company is running on x86 physical servers, and the performance of x86 physical servers is good, but the performance of the system is not satisfactory. And there have been several performance problems in the core system of a life insurance company before, but we can’t always find the root cause. Each time the reboot was completed, and it was not clear what the performance issue was doing to the system.
After installing Dynatrace, there are immediately performance alarms about the core system of a life insurance company, and the alarm is aboutGCWith a large impact on system performance (i.e., the GC overhead of the JVM exceeds the limit), we know the severity of the problem and where to start. After that, we identified the root cause of the system problem, one of which was loaded to monitor the parameters of the applicationjavamelodyjar package, the other becausesystem.gc()Frequent calls to fullgc cause the system to “stop the world” for too long.
Analysis process
Alarm
After installing Dynatrace on the core system of a life insurance company, the following alert email immediately appears:
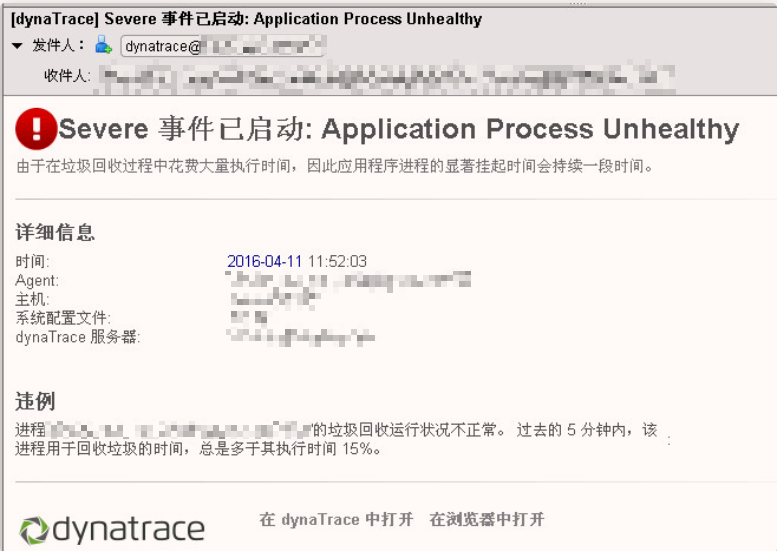
It can be clearly seen that the reason has been clearly written on the alarm email and pointed out the impact on performance:
Cause: ProcessXXXX_wls_hx_135a@appserver135:0The garbage collection is unhealthy. Because of the significant execution time spent during garbage collection, significant hangs of application processes persist for some time.
Impact: The process used to reclaim garbage for the last 5 minutes, alwaysMore than 15% of its execution time。
More than 15% of its execution time! Yes, it wasn’t until we saw this alarm that we realized that the performance problem was so serious, and the time spent on GC had exceeded 15% of the total execution time in a certain period of time, and this alarm was frequent. The details are as follows:
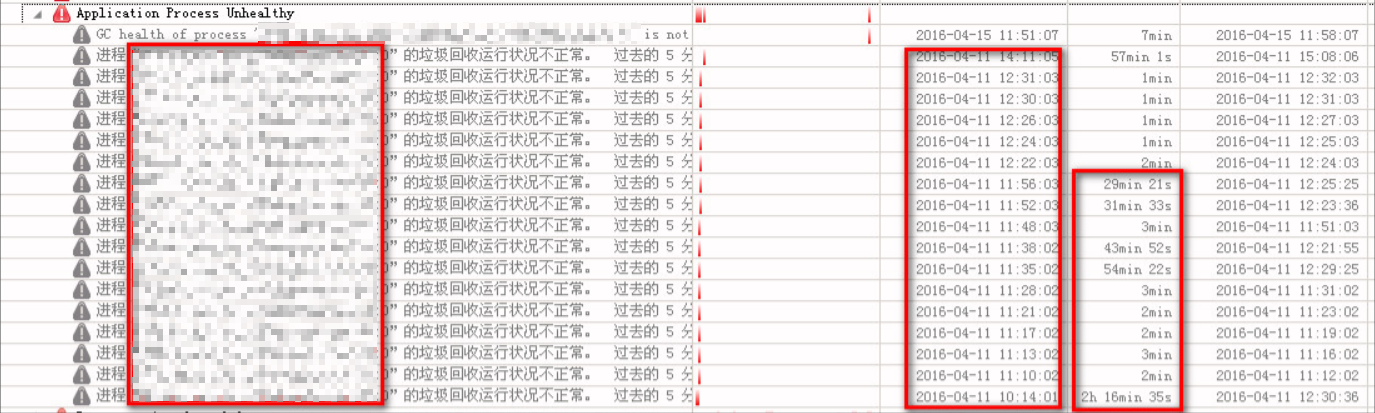
As you can see from the figure above, most of the machines in the core system have performance problems and are frequent, and sometimes even for up to 1 or 2 hours, GC time takes up more than 15% of the execution time! This is a serious performance issue. We didn’t first realize this problem until we used Dynatrace.
GC problem optimization
For further analysis, we used Dynatrace’s built-in instrument chart - application process diagram. The details are as follows:
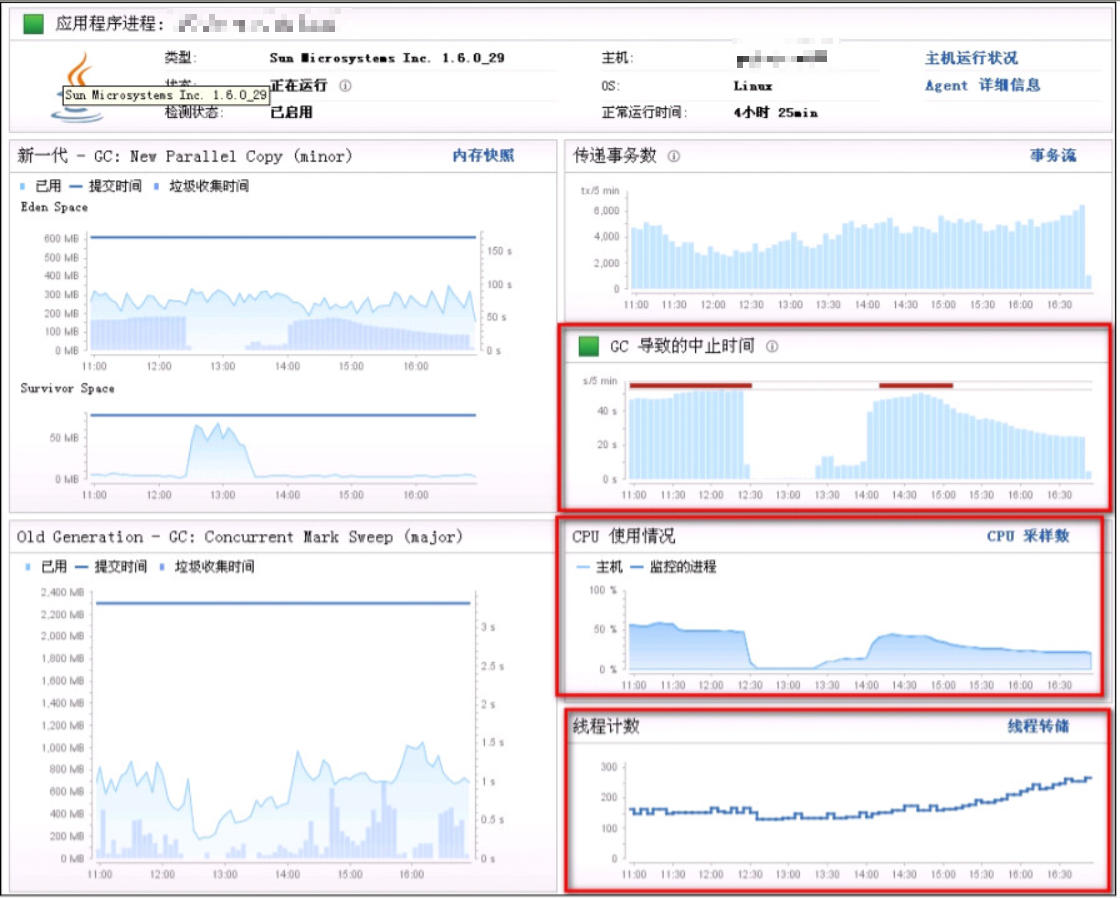
As can be seen from here, when the alarm is givenmajor gcGarbage collection takes longer, and Dynatrace’s major gc refers to GC that leads to “stop the world.”
Next, we analyzed the corresponding GC logs and found that there were a large number of logssystem.gc()(that is, the method is manually called in the program), and each call executes full gc. Regarding the explanation that SystemGC triggers full gc, we found the following reasons:
If the application uses features such as the NIO framework, DirectByteBuffer, or MappedByteBuffer, the memory generated by the above situation is off-heap memory, and SystemGC needs Full GC to reclaim it
After reviewing the information, I found a specific improvement method, which is as follows:
Join parameters
-XX:+ExplicitGCInvokesConcurrentThis parameter does not disable SystemGC, SystemGC will still be triggered, but after adding this parameter, it will make the CMS GC executed when System gc is executed, which will improve efficiency and reduce the STW time caused by Full GC.
After that, we added this parameter on one of the devices, compared it with other ones that were not added, and used the function of dynatrace’s custom dashboard to directly grab the parameter “Suspension Time” (the suspension time caused by GC in each time interval) to compare and draw a graph. It was found that the pause time caused by the addition of GC was greatly reduced! Since it was relatively early, the figure could not be found, attached is a conclusion analyzed using another gadget:
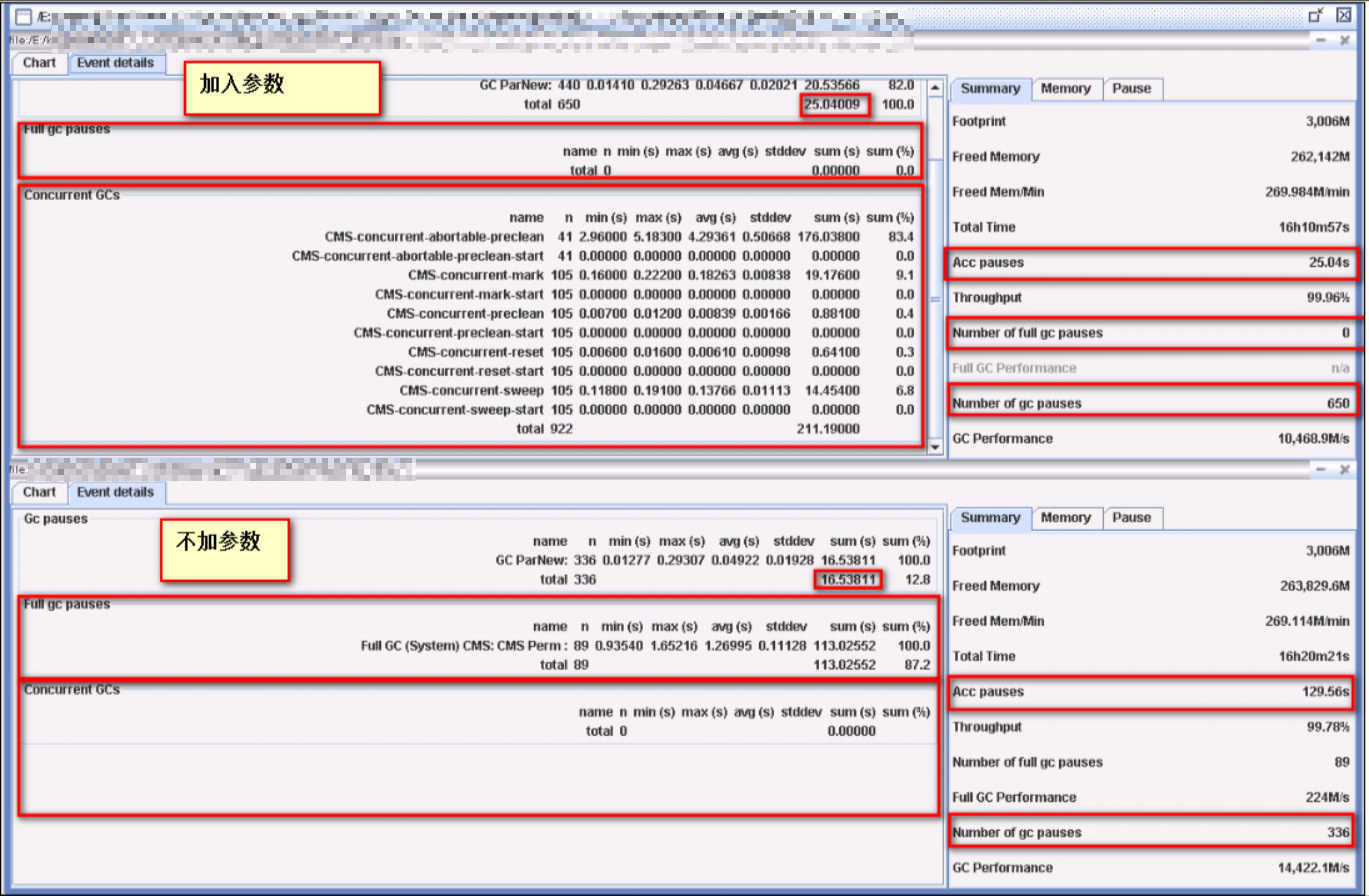
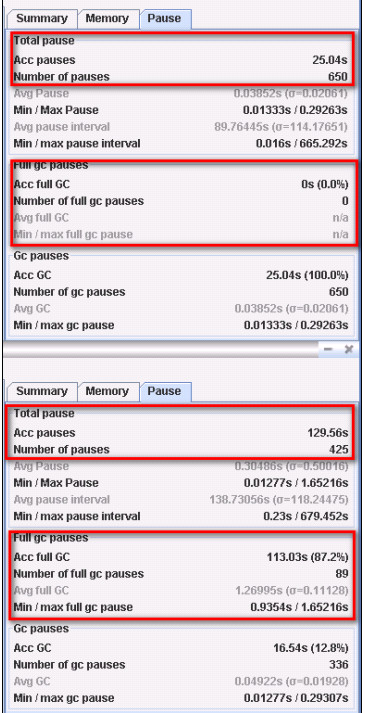
It can be seen that without this parameter, the pause time caused by GC is 129.56s; After adding this parameter, the pause time caused by GC is only 25.04s, which is 1/5 - 1/6 of the original pause time. With this parameter added, fullGC dropped from 89 to 0.
In short: the GC “stop the world” time is reduced by more than 100 seconds, and the full gc number is 0.
After confirming that adding this parameter can improve GC performance, we added this parameter to all JVMs in the core system. After joining, except for one of the machines, an alarm will be given, and the other machines are running normally. And the alarm machine, we found that there are other problems.
javamelody
One of them, even with the parameters mentioned above, the performance of GC is still problematic. The details are as follows:
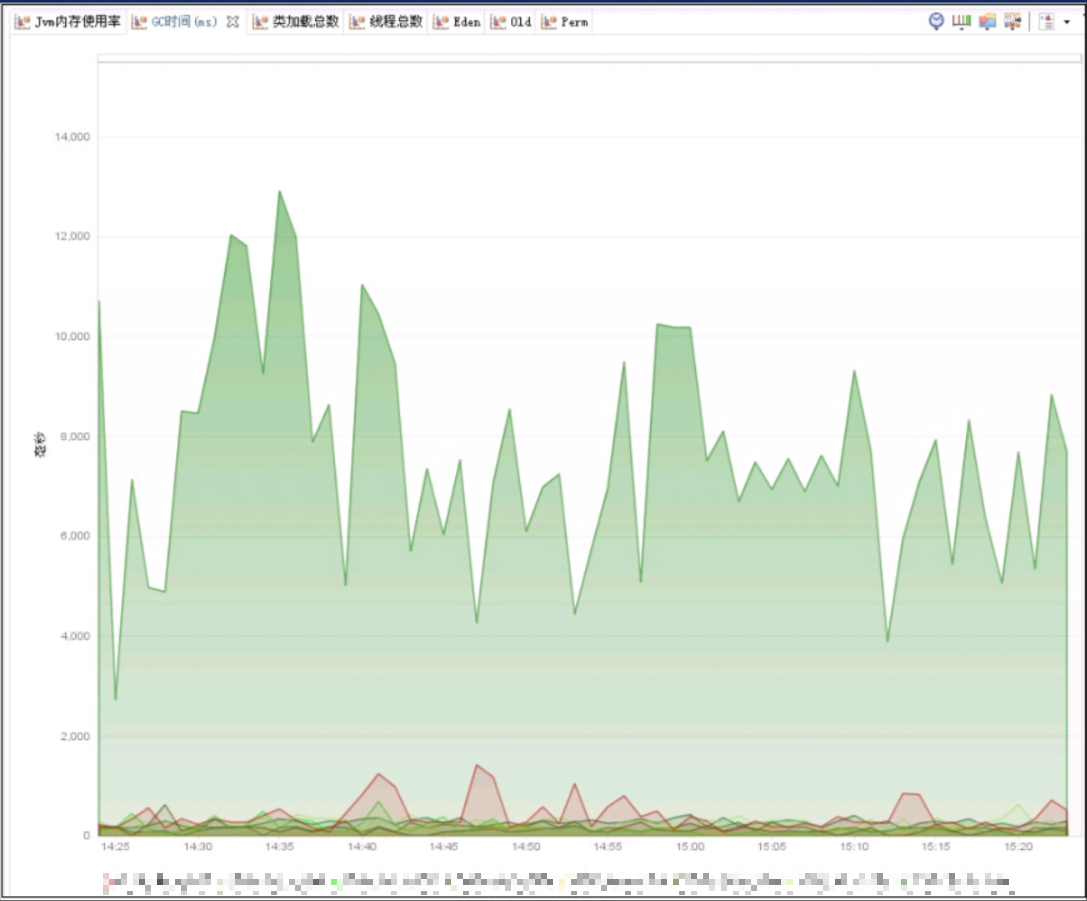
As you can see, the GC pause time, other jvms are on the order of magnitude around 10ms, while the other is6000msOrders of magnitude left and right! This has a great impact on the application, which can be seen in the following figure of Dynatrace:
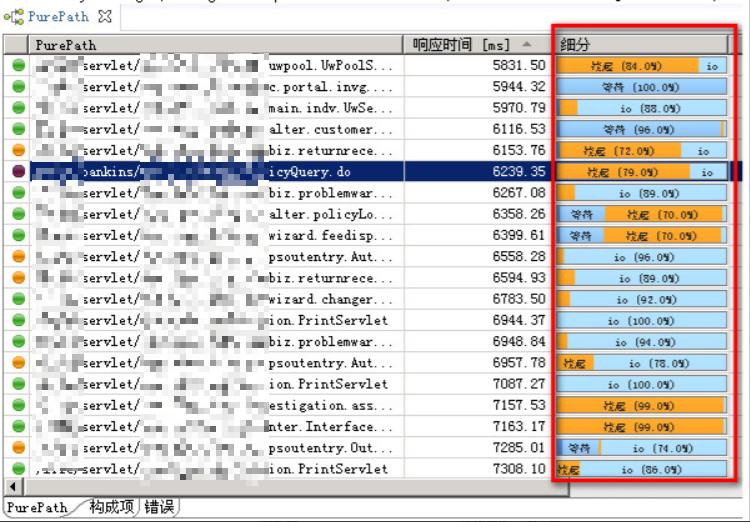
Directly leads to the application, specific to a request of the front-end user of the system, due to the GC “stop the world” caused by a significant increase in response time, the request that could have been completed in more than 100 ms was directly due toHangs caused by gcSpent more7000ms!
This time, we used dynatrace’s built-in CPU sampling hotspot analysis and memory snapshot analysis tools to analyze.
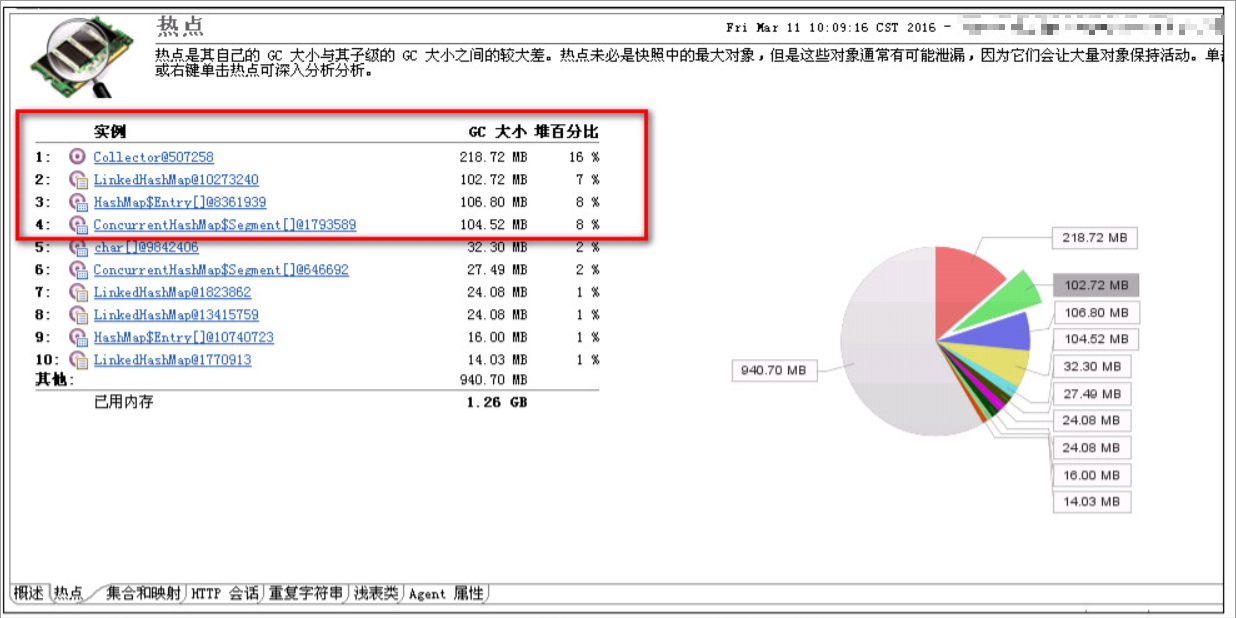
- Directly through DynaTrace, the JVM is Heapdump and analyzed directly on DynaTrace, and the analysis results are as follows: The examples 1-4 in the figure below are generated by the JavaMelody jar package.
- Through CPU sampling analysis, the results are as follows: it is directly seen that JavaMelody occupies more CPUs
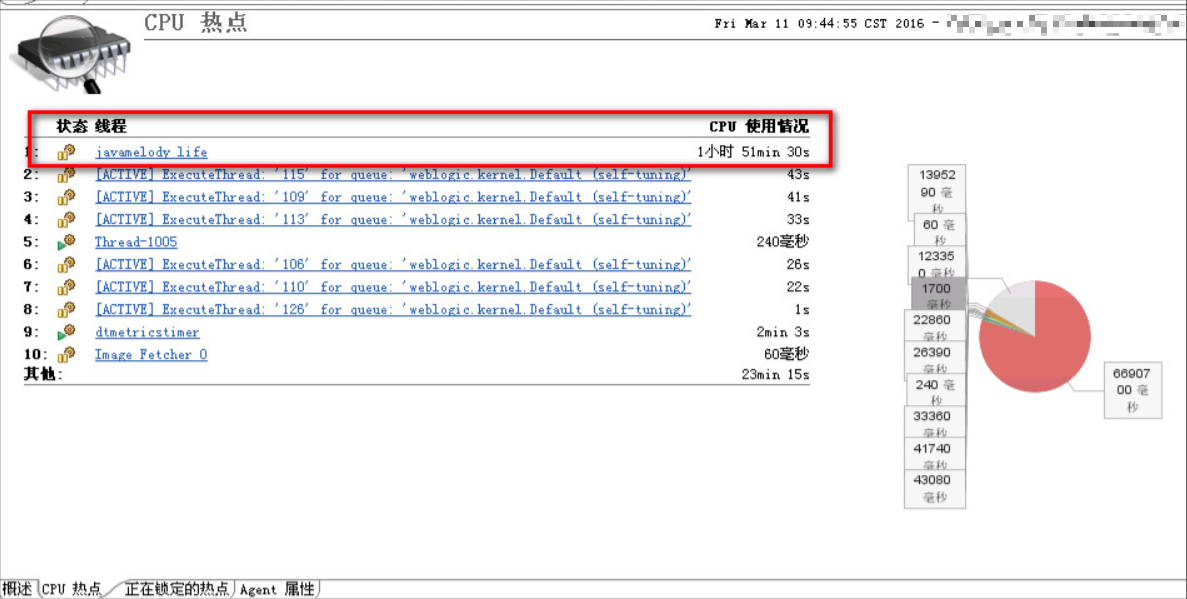
For comparison, the JavaMelody package is not loaded at all in other JVMs.
When the project team was contacted, the reply was:
javamelody-JVMMonitor the program. Can be used to analyze specific problem points. The jar package willTimed (more frequent) acquisitionsApply the relevant specified data, and make the dataPackage, compress, send。
These operations of javamelody consume both CPU and JVM memory resources. It has a great impact on the performance of the system. At our suggestion, the project team removed this jar package. Switch to Dynatrace’s dashboard and reports.
summary
With Dynatrace, we identified a problem with the core system and solved it with a quick analysis. After solving the problem, the core system runs smoothly and efficiently. From paying attention every day in the past, scratching your ears and cheeks when something went wrong, it has become today’s wind and clouds.