Case 1: A memory leak in a property insurance underwriting system
This article was last updated on: February 7, 2024 pm
A description of the memory leak
Today’s Dynatrace inspection found a memory leak in callCenter’s application. The details are as follows:
In the past 6H, the memory usage of the OLD area has continued to grow, eventually reaching 99.98%. And most of the OLD area memory cannot GC. At the same time, due to frequent GC, the time for JVM “STOP THE WORLD” is increasing. Severely impact business performance.
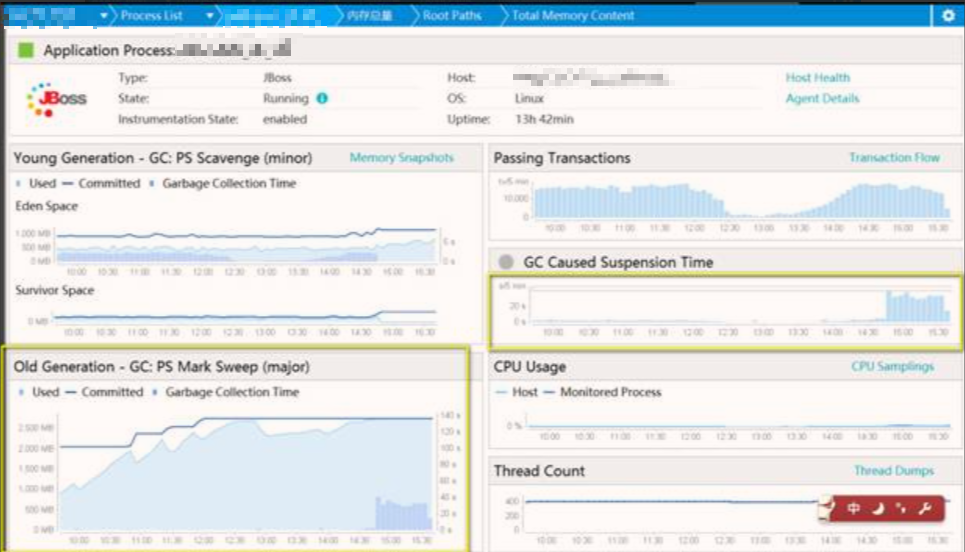
The following figure shows the impact on business performance:
A line chart is a response time that does not contain a stop the world, and a column chart is a response time that contains a pending one. You can see that the response time of the business has a certain impact.

2. Memory leak analysis
The results of the analysis using Dynatrace are as follows:
- There is indeed a memory leak. (The results of the analysis can be viewed in the following path on Dynatrace.)

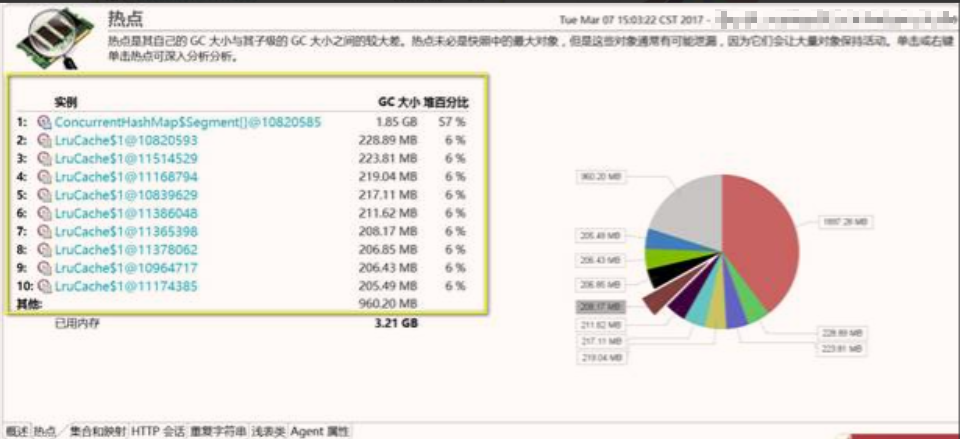
- Examples of leaks are mainly
ConcurrentHashMap”anddubbotargetLruCache(ConcurrentHashMapAlsodubbotargetLRUcacheThe invoked) is as follows:
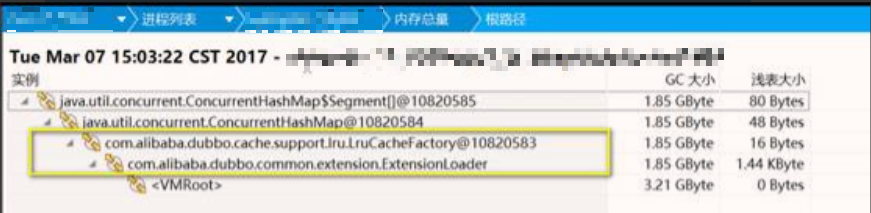
- The root causes of the leak are as follows:
com.alibaba.dubbo.common.extension.ExtensionLoaderandcom.alibaba.dubbo.cache.support.lru.LruCacheFactory
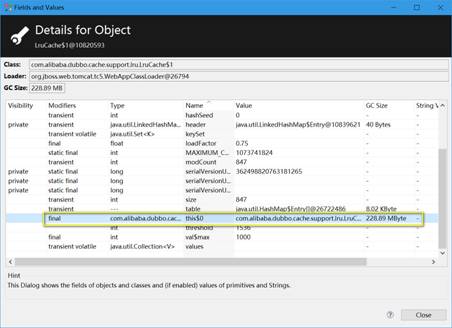
- The details of the LRU class are as follows:
III Summary
In summary,dubbo The LRU-related class caused a memory leak.
Possible reasons are: there is a problem with the cache size of the LRU cache; There is a problem with the expire time; Or the relevant cache always has a reference, resulting in the inability to GC.
Also optimize your code to avoid memory leaks.