Case 3: Analysis of memory overflow in Perm area at runtime of a property and casualty insurance company
This article was last updated on: February 7, 2024 pm
A Overview
1.1 Customer Needs
1.1.1 Customer Problem Description
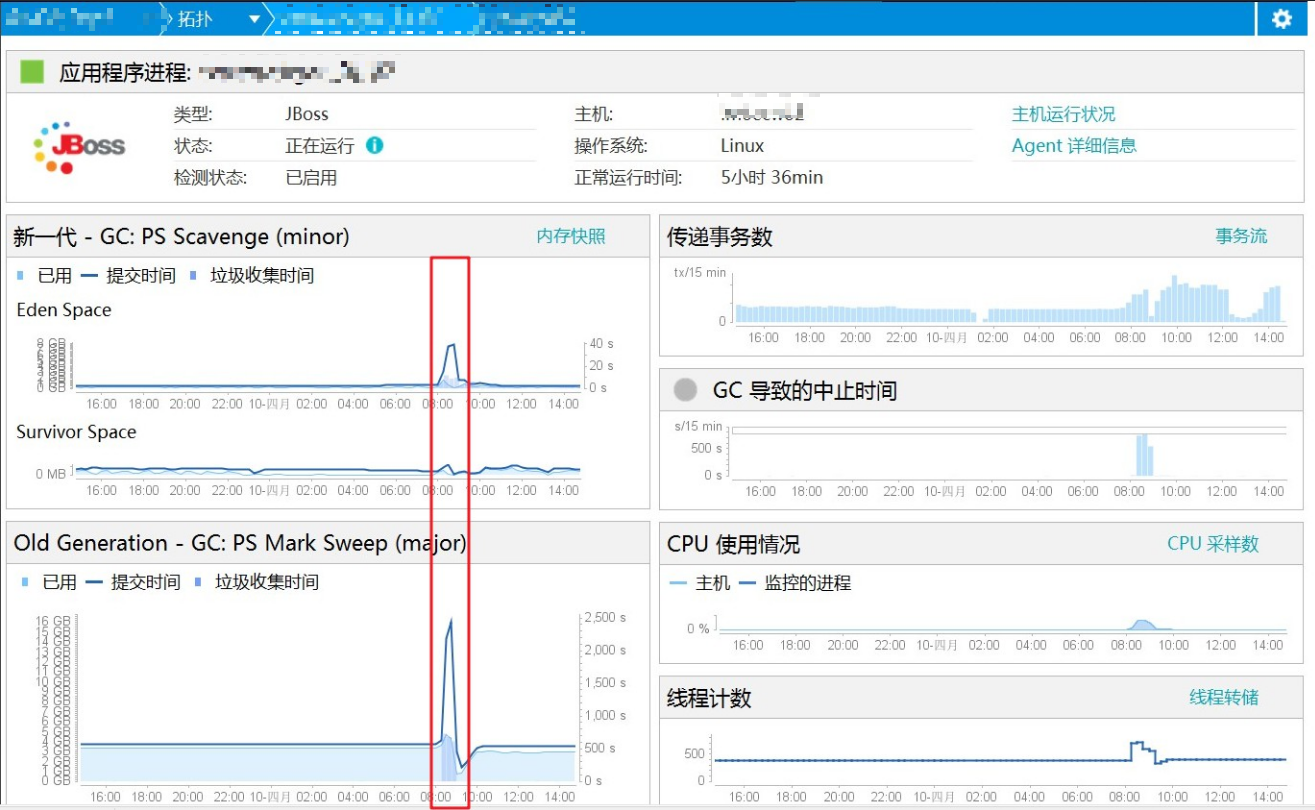
Customers discover a Jboss JVM through DynatraceMemory commits abruptly and then garbage collection。 As shown in the figure below.
1.1.2 Customer Needs
Customers want to know about Root Cause.
1.2 Overview of Information Collected
The customer noticed a sudden increase in Jboss’s memory and a significant increase in the GC time of the JVM. Looking at Dynatrace, the node had already happenedPerm area memory overflow。 And there isAlarm(at the same time, the application of business-critical error rate increased significantly) (the increase in OLD area and GC time caused by the memory overflow of the Perm area, see below for specific analysis). As shown in the following figure:


2. Scope of the accident
Looking at the host, JVM, and application business at the time, the issue had a series of knock-on effects, including:
- Increased CPU utilization
- Physical memory rises
- The JVM heap area grows
- The JVM gc and suspend time become longer
- The number of Jboss threads goes up
- Critical business failures
- Slow response to critical business
The details are as follows:
2.1 Host

2.2 Middleware

2.3 Application

3. Problem analysis and positioning
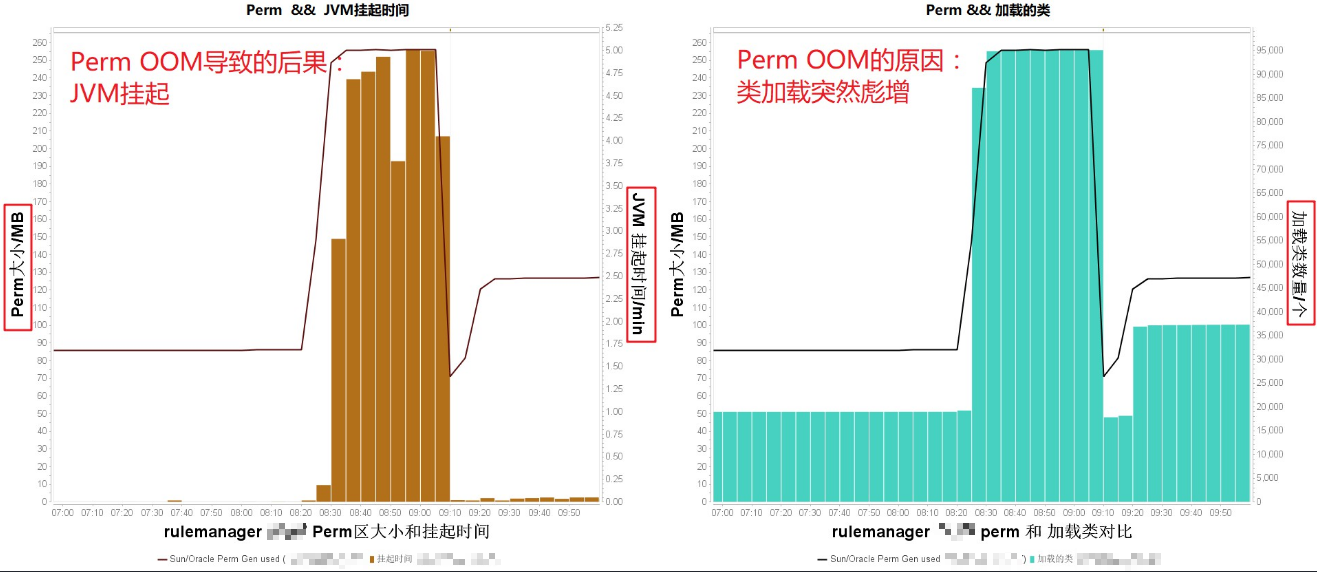
3.1 I customize 2 gauge charts to analyze the problem
The following figure is required.The reason for direct Perm OOM is: a huge increase in class loading(Because the Perm area stores static classes and constants, etc., and the Perm OOM JDK does fullgc by default, resulting in increased gc and suspension time; Because it cannot be GC removed, it will lead to the adjustment of the Heap area, the increase of CPU, and the increase in the number of threads)
3.2 Why does the loaded class suddenly skyrocket?
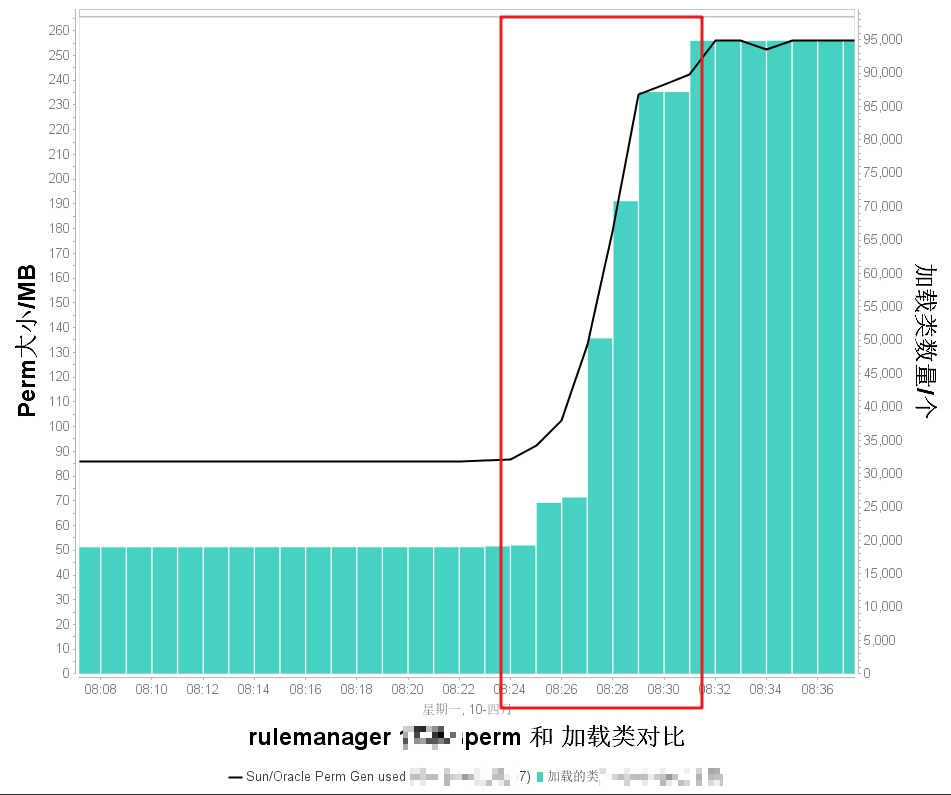
Let’s zoom in on the image above to see the details. As shown in the following figure:
The number of class loads is in8:25-8:30Significant growth during the period.Next, we need to see what exactly the Jboss is doing during this period.
3.3 Check out purepath on Jboss from 8:25-8:30
PurePath is a simple understanding: the distributed method call stack of all transactions and related information. (such as response time, time segmentation, threads, LOG, Exception, SQL, Message, etc.)
As shown in the figure below, it can be directly seen:
-
The root cause transaction that caused the problem: /RuleManager/showCalib1QueryCondition.htm
-
The root casue code that caused the problem: c3p0 (c3p0 performance issue. There will be class loading before and after calling c3p0, and it is this situation that leads to a large number of class loading at that time) (The figure below forName0 is the relevant method of class loading)

4. Summary and optimization suggestions
4.1 Order in which problems occur
-
A large number of /RuleManager/showCalib1QueryCondition.htm requests occurred
-
A large number of C3p0-related classes need to be loaded
-
The number of class loads has grown significantly
-
The Perm area ran out of 256M memory
-
Trigger JVM full gc
-
GC and suspend time increase
-
Unable to GC → CPU increase, thread increase, heap area increase, service failure
4.2 Optimization Recommendations
4.2.1 Middleware (treating the symptoms but not the root cause)
-
Increase the size of the Perm area
-
Optimize parameters related to Perm cleanup (e.g. Perm cleanup when full, do not perform full gc, etc.)
-
To make it easier to locate problems, especially without Dynatrace,We recommend that you enable GC logs in the production environment.
ALI’S JAVA EXPERTS SAID:
In fact, it doesn’t matter if you open GC logs online, we have always opened them online, and it will not have such a big impact on performance.
4.2.2 Development
- Optimize JDBC related code (if you want to optimize c3p0 code, you can see the code logic of 3.3.) If you don’t want to optimize, it is recommended not to use c3p0 as the JDBC framework directly, and choose other JDBC frameworks)
4.3 One final word
In fact, this problem has been analyzed a month ago, but because the impact at that time is onlySlow down application critical business, so it did not attract attention. However, this time the impact was relatively large, directly leading to the failure of all key businesses and the long suspension (i.e. unavailability) of Jboss.
Therefore, large production accidents may actually be caused by some small, performance problems that we think are okay or can be ignored.
:p unch: Production is no small matter! Responsibility is greater than the sky!