Kubecost | Kubernetes Overhead Monitoring and Management
This article was last updated on: July 24, 2024 am
👉️URL: https://www.kubecost.com/
📝Description:
Kubeccost provides real-time cost visibility and insights to teams using Kubernetes to help you continuously reduce your cloud costs.
When I browsed the Kubectl plugin yesterday, I found Kubecost, and I was shocked to see that this feature is too important for the operations team and PM team leaders. Directly convert monitoring data into money, and clearly tell you which namespace, which application, which label, which deployment the money is spent on, clearly tell you what money is worth spending, what money is wasted, and what ways to reduce waste… It’s really a real “cost reduction” function.
Let’s take a closer look.
Highlights: Monitor and reduce cloud costs
Kubeccost provides real-time cost visibility and insights to teams using Kubernetes to help you continuously reduce your cloud costs.
Product features
💰️ Cost allocation
Divide costs by Kubernetes concept, including deployment, service, namespace, label, and so on. Spend views can span multiple clusters in a single view or through a single API endpoint.
📺 Unified cost monitoring
Combine the cost of Kubernetes with the spending of any external cloud service or infrastructure to get a complete picture. External costs can be amortized and then attributed to any Kubernetes concept to achieve a comprehensive spend.
⚖️ Cost optimization scenarios
atNo sacrificing performanceAccept on the premisedynamicadvice. Prioritize critical infrastructure or application changes to improve resource efficiency and reliability.
🔔 Cost alerting and governance
alerts: # Kubecost 产生关于群集数据的警报
    # 在命名空间 `kubecost` 的每日预算警报
  - type: budget # 支持: 预算, recurringUpdate, 等.
    threshold: 50 # 预算警报所需
    window: daily # 或 1d
    aggregation: namespace
    filter: kubecost
Quickly capture cost overruns and infrastructure disruption risks before they become real-time notification issues. Preserve engineering workflows by integrating tools like PagerDuty and Slack.
It can also run in the following environments:
- Azure
- AWS
- Google Cloud
- Intranet environment
- Kubernetes
- On-premises deployment
Installation
It can be installed using Helm Chart.
! [[K8S Utility IV - kubectl utility plugin #cost https github com kubecost kubectl-cost]]
Installation can be found here:K8S Utility IV - kubectl utility plugin: cost》
After the deployment is complete, access port 9090 of kubecost-cost-analyzer to view the UI, Ingress mode or port-forward.
1 | |
upgrade
1 | |
unload
Also Helm:
1 | |
🤑 Actual effect display
In my cluster, for example, this shows not the UI, this shows the white flowers, green dollars 💵!
Kubecost has the following menu items, each of which is a money-saver.
- 🏠️ Overview
- 📊 Cost allocation
- 🧰 Asset.
- 💲 Throttling.
- 🛑 Health status
- 📃 Report.
- 🔔 Cost alerts
Overview
Via port-forward, access http://localhost:9090, the first page is unremarkable:
Kubecost Screen 1: Cluster cluster #1, 5 nodes, $138.39 per month.

After clicking in, the real killer comes:
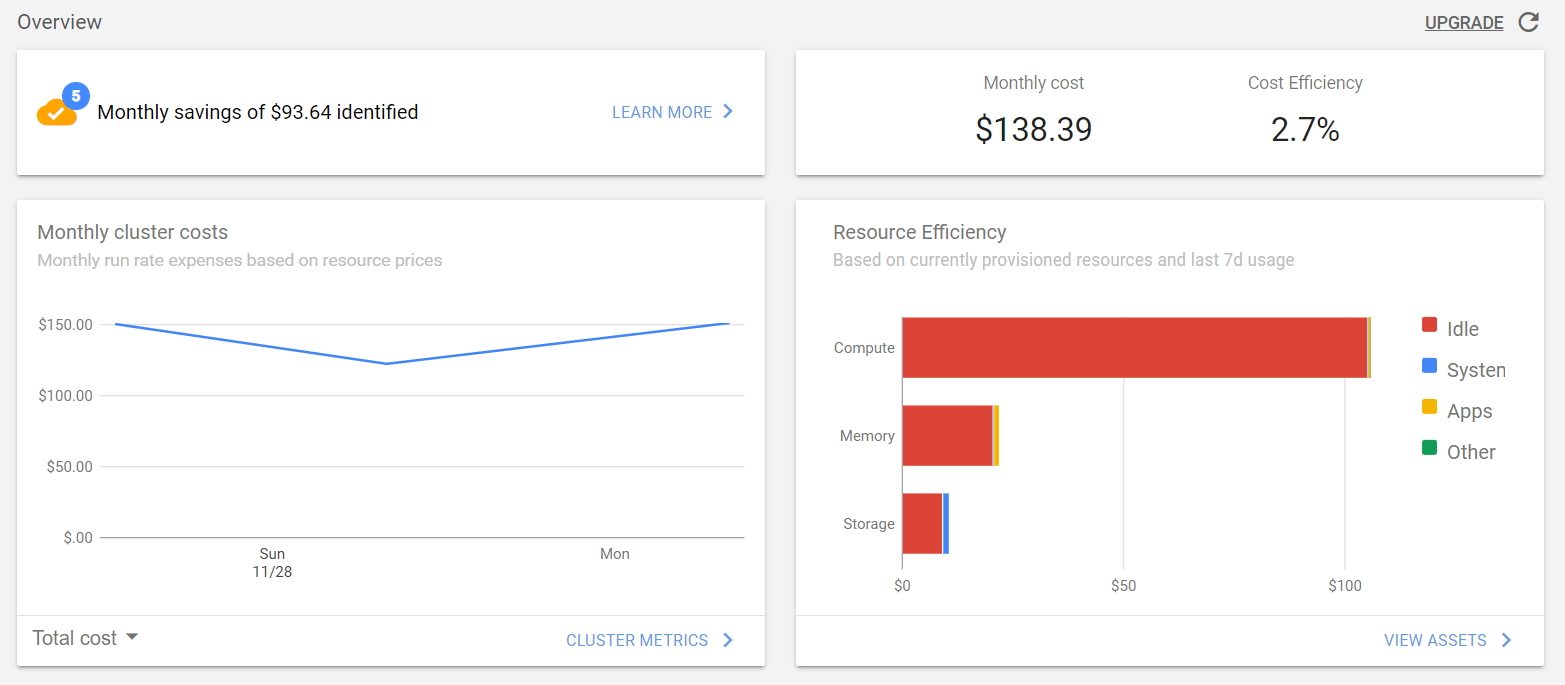
-
Top left: Identified 5 money-saving tips that saved me $93.64 per month. 🤑
-
Upper right corner: $138.39 per month, 2.7% cost-effective, 97.3% all make cloud vendors prostitute 😱
-
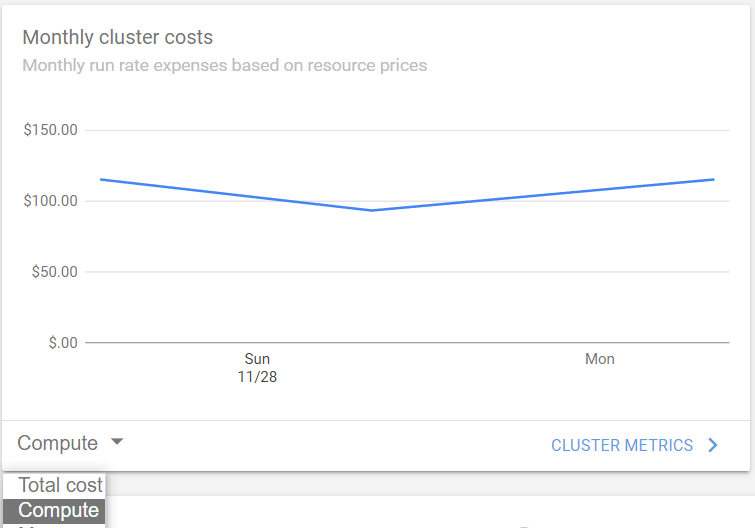
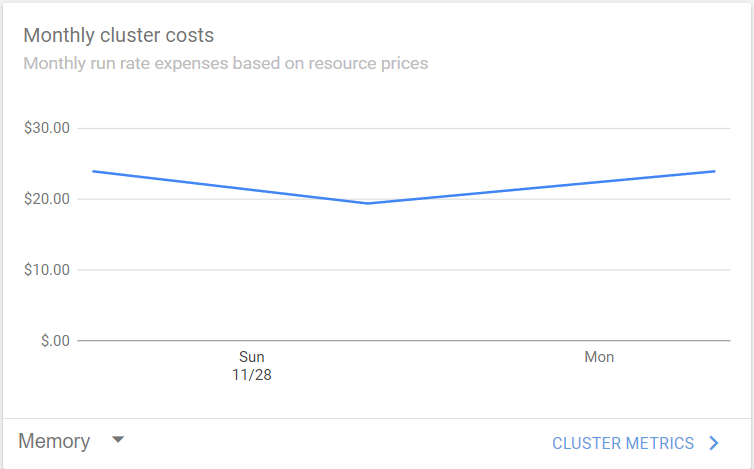
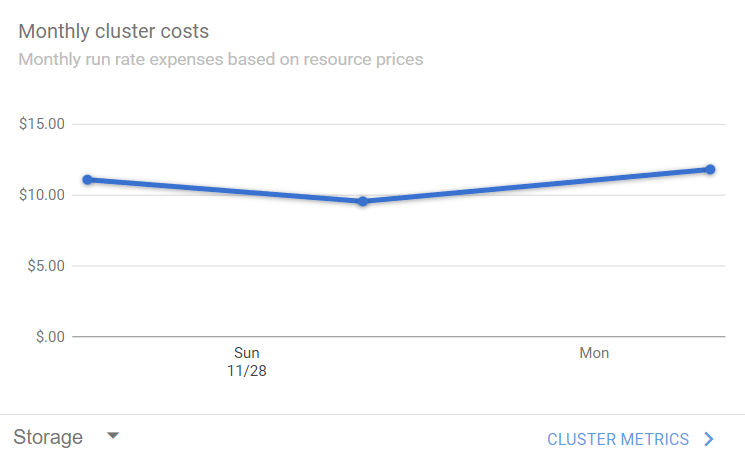
Bottom left: Monthly cluster overhead, monthly running rate cost chart based on resource price, here can also be split into:
-
Compute:
-
memory
-
storage
-
Furthermore! Click “CLUSTER METRICS” on the right to jump directly to our familiar Grafana dashboard to view monitoring metrics and 💵 specific contacts. (Added in the next article)
-
-
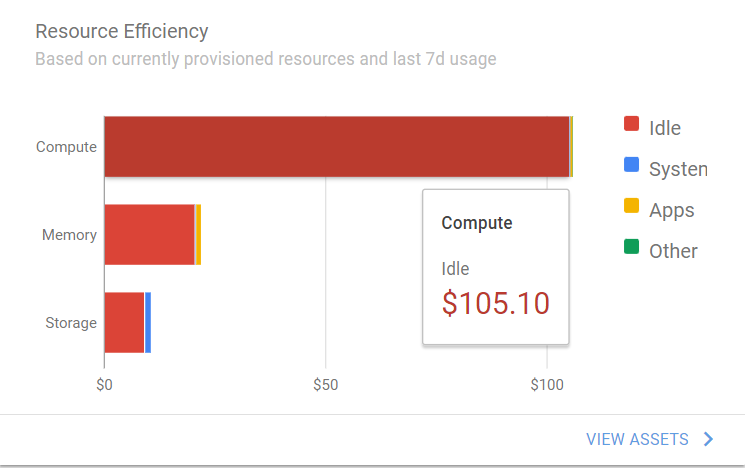
Bottom right: Resource waste rate (🙊 resource utilization), based on the resources currently purchased and the usage of the last 7 days
- Calculation: $105.10 😱 per month for empty runs
- Memory: $20.51 😱 per month
- Storage: $9.10 😱 per month
- After gouging the empty run, my application mainly consumes $1.34 of memory, and the storage side of System uses $1.53
Overview continues to pull down, still shocked:

- Upper left corner: Based on the cost allocation of the Controller dimension, calculate the monthly allocated cost of the Controller based on the resource consumption in the past 2 days, such as my:
kubecost/deployment:kubecost-cost-analyzerCost $8.37 (17.1%)monitoring/statefulset:prometheus-prometheus-operator-prometheusCost $5.83 (11.9%)monitoring/statefulset:alertmanager-prometheus-operator-alertmanager: Cost $2.81 (5.7%)
- Upper right corner: Based on the cost allocation of the service dimension, the monthly allocated cost of the service is calculated based on the resource consumption in the past 2 days, such as mine:
kubecost/kubecost-cost-analyzerCost $8.37 (17.1%)- …
- Bottom left: Cost allocation based on the NameSpace dimension, and cost-benefit score (1-100), such as mine:
- Kubecost: $10.74 per month, 22 points benefit, fail! 😱
- Monitoring: $9.63 per month, 42 points in benefit, failing! 😱
- Crossplane-system: $5.70 per month, 5 points of benefit, five scum! 😱
- kube-system: $2.71 per month, 17 points benefit, fail! 😱
- loki-stack: $0.66 per month, out of pocket! (Loki YYDS ? )💯
- Bottom right: Infrastructure Health, 94 (Cluster Health Rating is an assessment of infrastructure reliability and performance risk, with scores ranging from 1-100), which belongs to spending money to keep safe. 😂
ℹ️ prompt:
Cost efficiency is defined as CPU and RAM (usage / request). If a resource is used, but there is no request resource, then the efficiency is considered unlimited.
Cost allocation
Go to the second menu, cost allocation, and the effect is as follows:
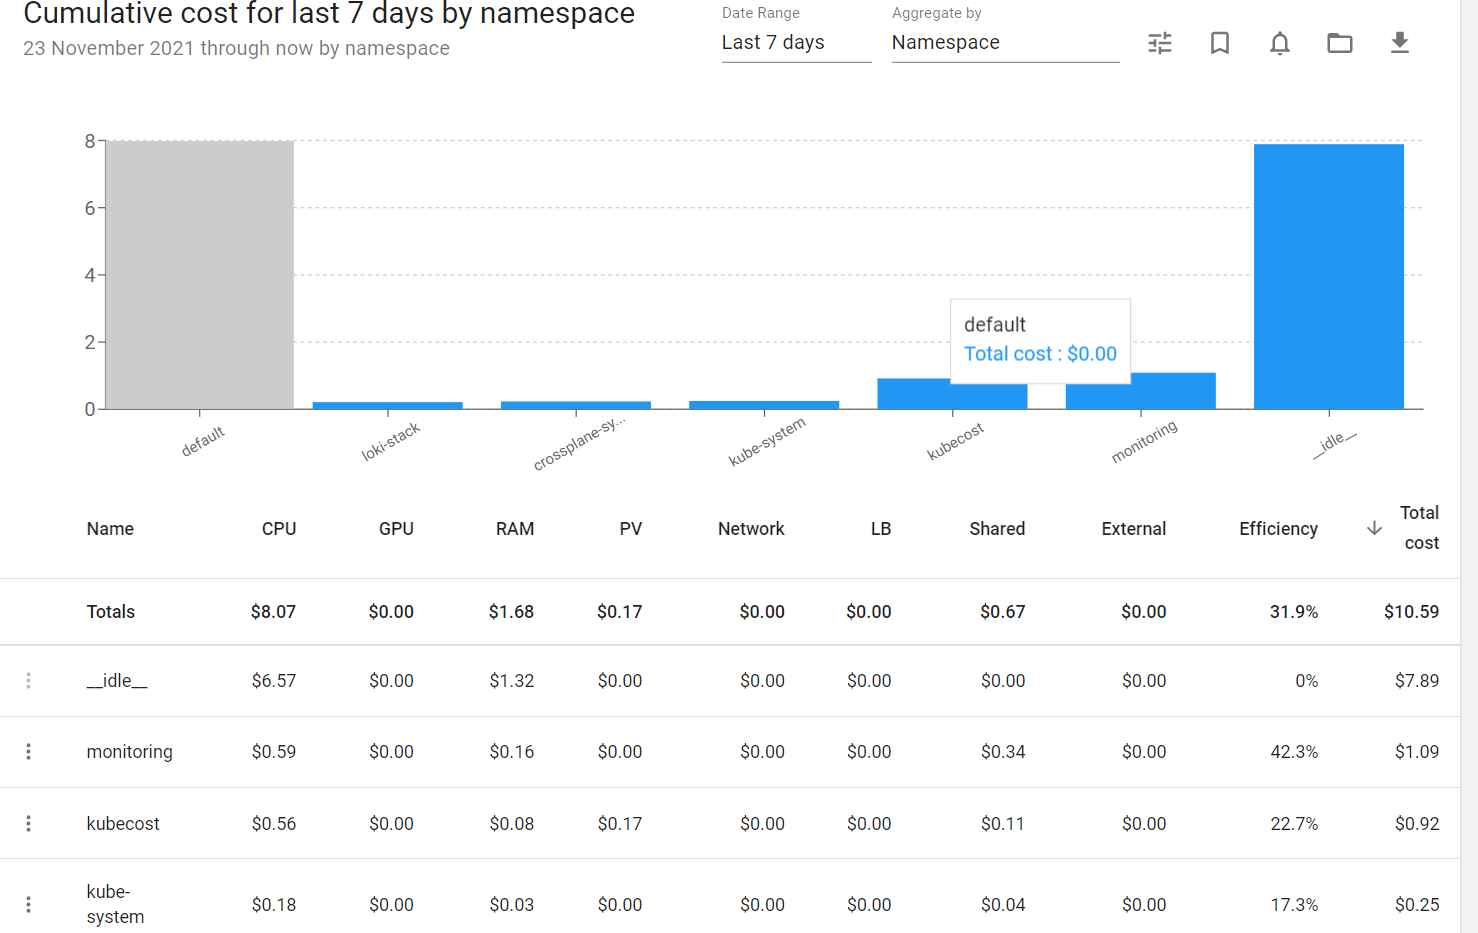
Fine-grained to: CPU, GPU, RAM, PV, Network, LB, Shared.
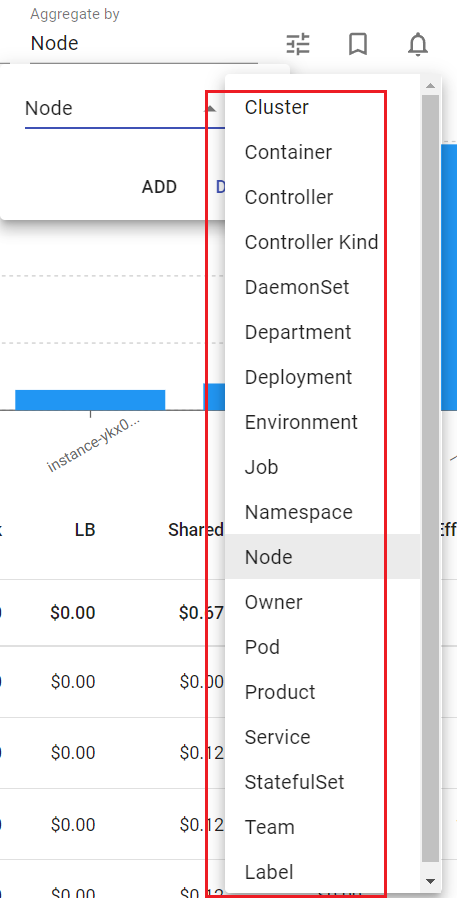
In addition, cost-effectiveness can be analyzed according to many dimensions, which I think should meet the needs of leaders:
asset
ℹ️ prompt:
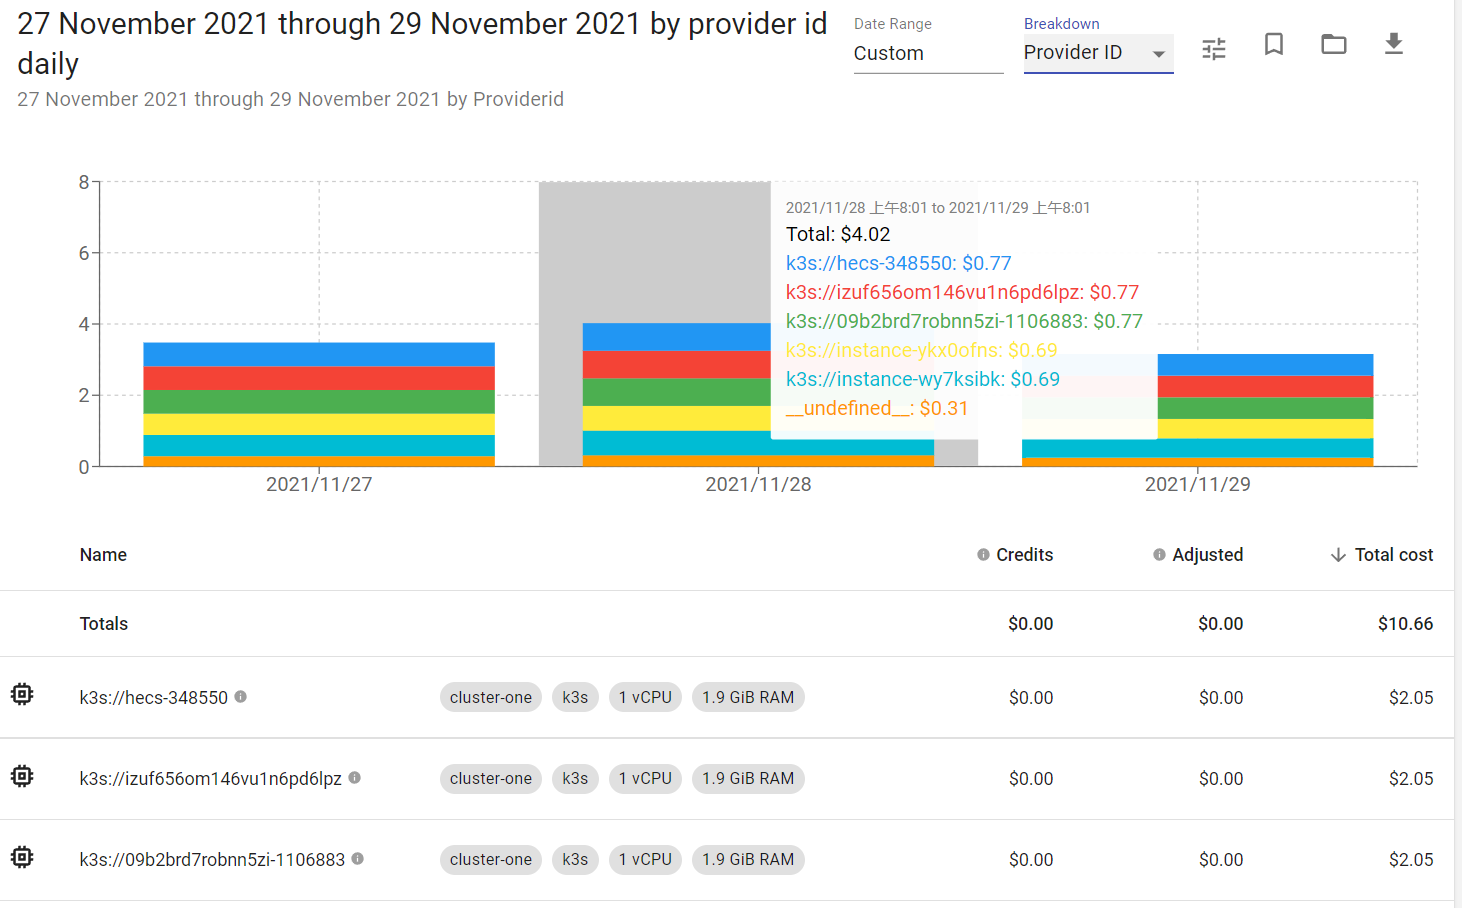
After the information of assets and public clouds is connected, richer information can be obtained, such as cloud account and supplier type.
The current version can be intertwined: AWS and GCP, but it is a paid feature.
The following figure shows the asset information:
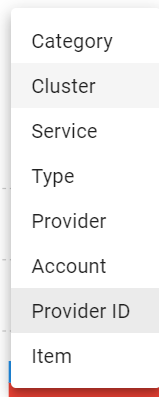
It is also possible to split from multiple dimensions:
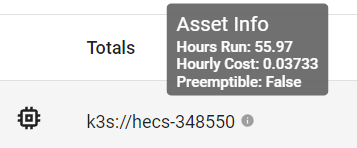
Hover over the info button and it will tell you the billing unit: (the billing unit price can be adjusted). As shown in the following figure:
- Node overhead per hour: $0.03733.
Throttling
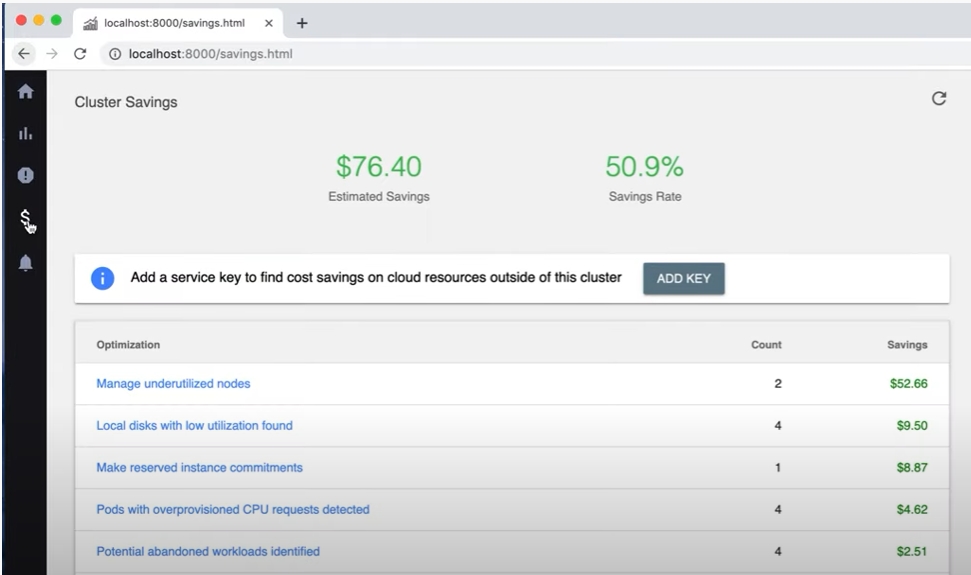
As shown in the figure below, you can assess how much money you can save per month and the proportion of savings. and specific throttling measures:
- Manage low-utilization nodes
- Low local disk utilization
- There are too many requests for pod configuration
- Identify potentially unused wordloads
Health status
This function is more general, which is similar to the K9S popeye. The effect is as follows:
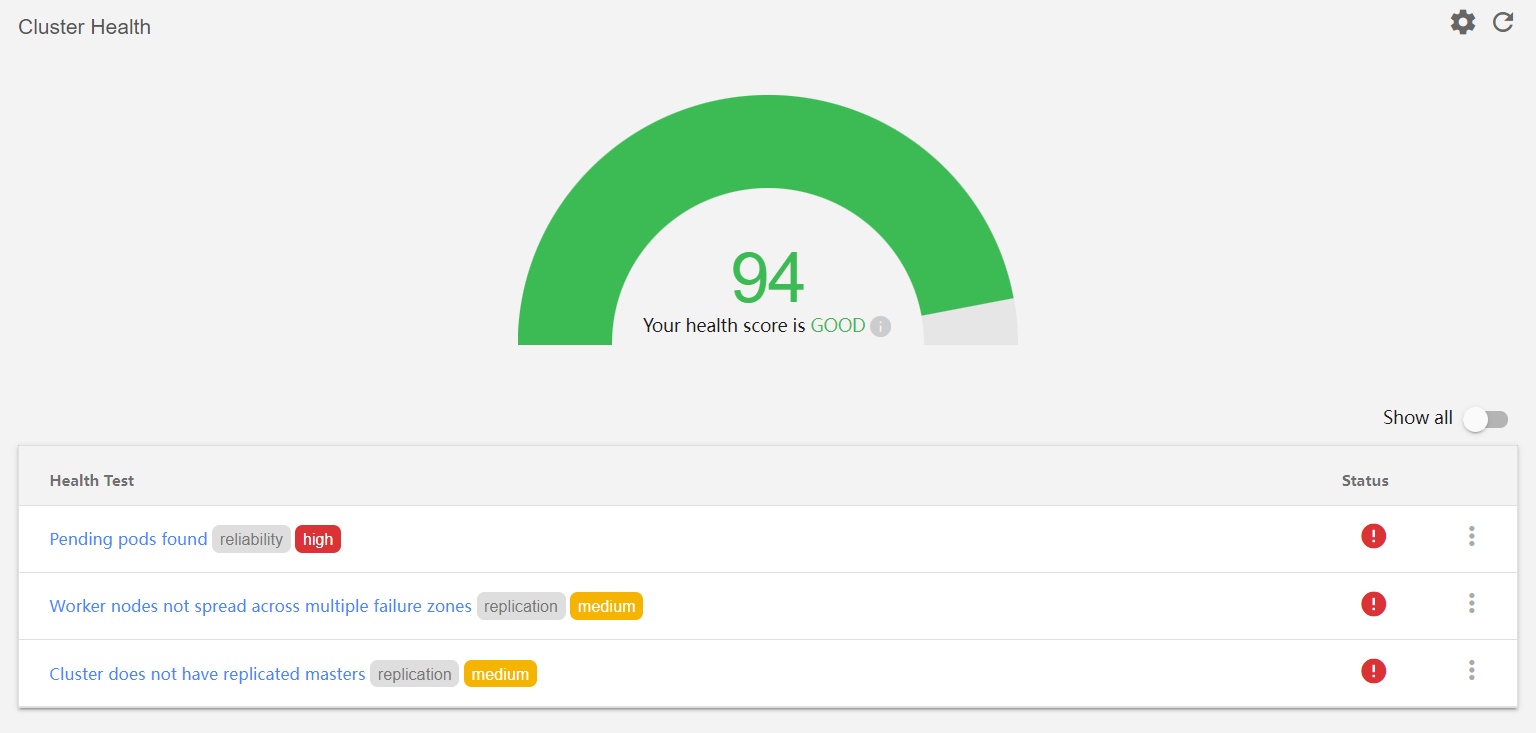
- There are Pod pending
- Worker nodes are not spread across multiple Availability Zones (which is a good 👍️ tip)
- The cluster does not have a master replica
There will also be a detailed guide to click in, as shown below:

report
The report is based on the two dimensions of cost and asset, and the regular report is customized according to the above instrument.

Cost alerts
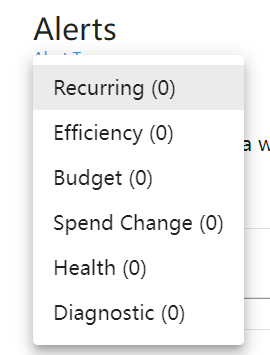
Cost alerts are alarms, and the main difference is based on 💵 the dimension:
- Recurring classes
- Cost-effectiveness class
- Budget class
- Cost change class (such as the alarm in the product function above is a sudden increase in overhead of 50%)
- Health class
- Diagnostic class
Set up
The customization is quite comprehensive, let’s talk about some configurations that I think are practical:
- Configure the label, for example: the label corresponding to the tenant is the tenant, the label corresponding to the department is the apartment, and the label corresponding to the product is the app…
- Price class settings, you can set:
- discount
- Share overhead ratio, corresponding NS, Label, etc
- unit price
- currency
summary
If you look at it in its entirety, if you let the operations team and PM team leaders see it, you will definitely love it. 🤑🤑🤑


