Three scenarios for monitoring Kubernetes cluster certificate expiration times
This article was last updated on: February 7, 2024 pm
preface
Kubernetes uses a lot of certificates, such as CA certificates, as well as components such as kubelet, apiserver, proxy, etcd, and kubeconfig files.
If the certificate expires, you will not be able to log in to the Kubernetes cluster, or the entire cluster will be exceptional.
In order to solve the problem of certificate expiration, there are generally the following ways:
- Significantly extend the validity period of the certificate, from as short as 10 years to as long as 100 years;
- Certificates that are about to expire are automatically rotated, such as Rancher’s K3s, RKE2 uses this method;
- Increase the monitoring of certificate expiration to facilitate early detection of certificate expiration problems and manual intervention
This article mainly introduces the monitoring of Kubernetes cluster certificate expiration, and provides three monitoring solutions:
- use Blackbox Exporter Monitor Kubernetes apiserver certificate expiration through Probe;
- use kube-prometheus-stack Monitor the expiration time of relevant certificates through apiserver and kubelet components;
- use Enix’s x509-certificate-exporterMonitor all nodes in the cluster
/etc/kubernetes/pkiand/var/lib/kubeletand the kubeconfig file
Solution one: Blackbox Exporter monitors Kubernetes apiserver certificate expiration time
Blackbox Exporter is used to probe endpoints such as HTTPS, HTTP, TCP, DNS, ICMP and GRPC. After you define the endpoint, Blackbox Exporter generates metrics that can be visualized using tools such as Grafana. One of the most important features of Blackbox Exporter is measuring the availability of endpoints.
Of course, Blackbox Exporter can obtain the relevant information of the certificate after detecting HTTPS, which is to monitor the expiration time of the Kubernetes apiserver certificate in this way.
Configuration steps
-
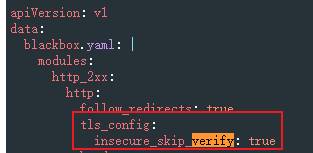
Adjust the configuration of Blackbox Exporter, add
insecure_tls_verify: trueAs follows:
-
Restart Blackbox Exporter:
kubectl rollout restart deploy ... -
Add access to the Kubernetes APIServer internal endpointhttps://kubernetes.default.svc.cluster.local/readyzof monitoring.
-
If you are not using Prometheus Operator and are using the native Prometheus, you need to modify the configmap or secret of the Prometheus configuration file and add scrape config, as shown in the following example:
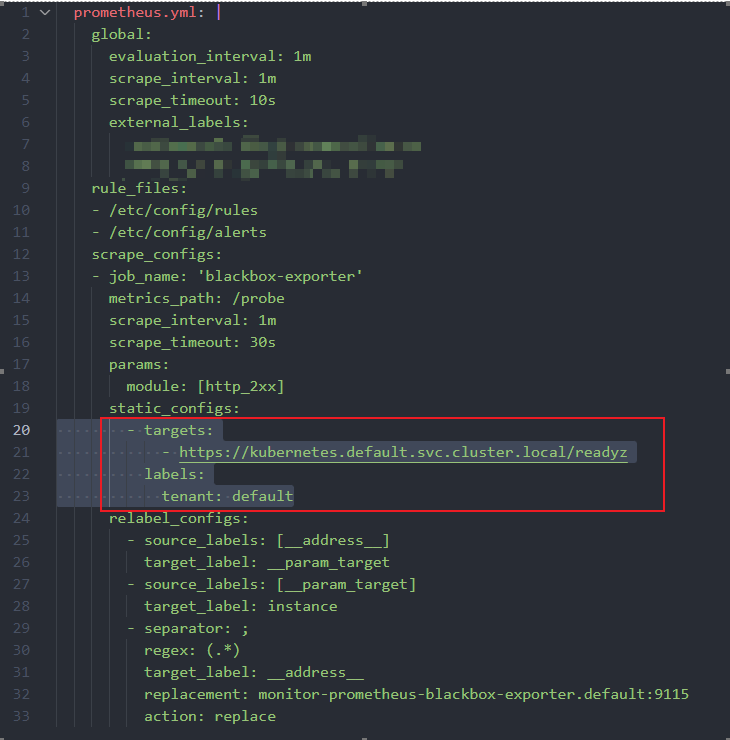
-
If you are using Prometheus Operator, you can add the following Probe CRD, and Prometheus Operator will automatically convert and merge it into Prometheus.
-
1 | |
Finally, you can add Prometheus Alarm Rule, here you can directly use Prometheus Operator to create a PrometheusRule CRD as an example, the example is as follows:
1 | |
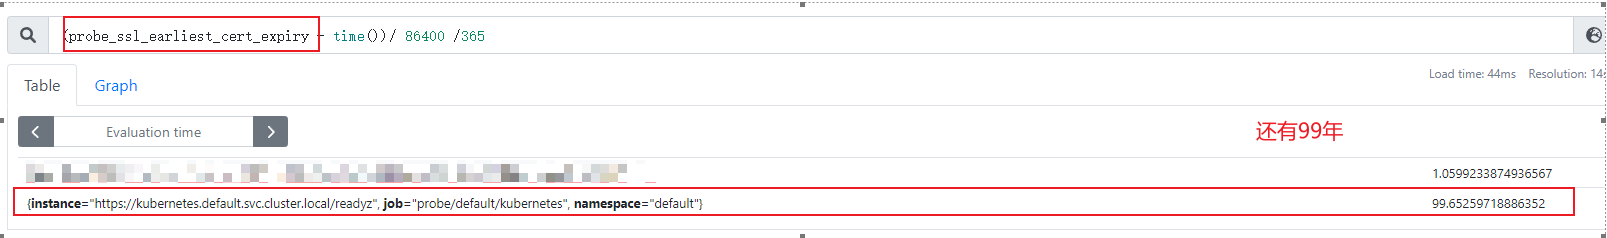
effect
Scenario two: kube-prometheus-stack monitors certificate expiration through apiserver and kubelet components
Here you can refer to my article:Prometheus Operator and kube-prometheus bis - How to monitor a 1.23+ kubeadm cluster, After the installation is complete, it works out of the box.
Out-of-the-box content includes:
- Crawl apiserver and kubelet metrics; (i.e. serviceMonitor)
- Configure alarms related to certificate expiration time; (i.e. PrometheusRule)
The indicators used here are:
- apiserver
apiserver_client_certificate_expiration_seconds_countapiserver_client_certificate_expiration_seconds_bucket
- kubelet
kubelet_certificate_manager_client_expiration_renew_errorskubelet_server_expiration_renew_errorskubelet_certificate_manager_client_ttl_secondskubelet_certificate_manager_server_ttl_seconds
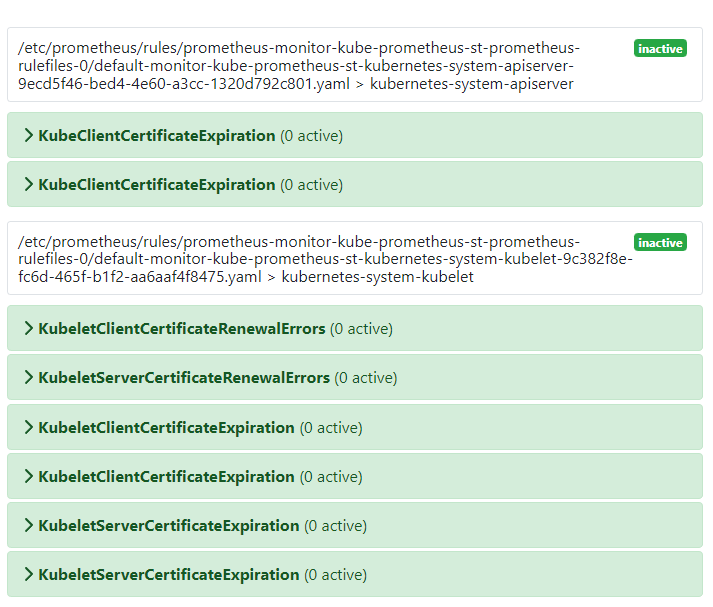
Monitor the effect
The corresponding Prometheus alarm rules are as follows:
Solution three: Use enix’s x509-certificate-exporter
Means of surveillance
The exporter obtains certificate information by monitoring the certificate file under the specified directory or path of all nodes in the cluster and the kubeconfig file.
If you are using a Kubernetes cluster built with kubeadm, you can monitor the following files containing certificates and kubeconfig:
1 | |
Install the configuration
Edit values.yaml:
1 | |
Install via Helm Chart:
1 | |
This Helm Chart is also automatically installed:
- ServiceMonitor
- PrometheusRule
Its monitoring metrics are:
x509_cert_not_after
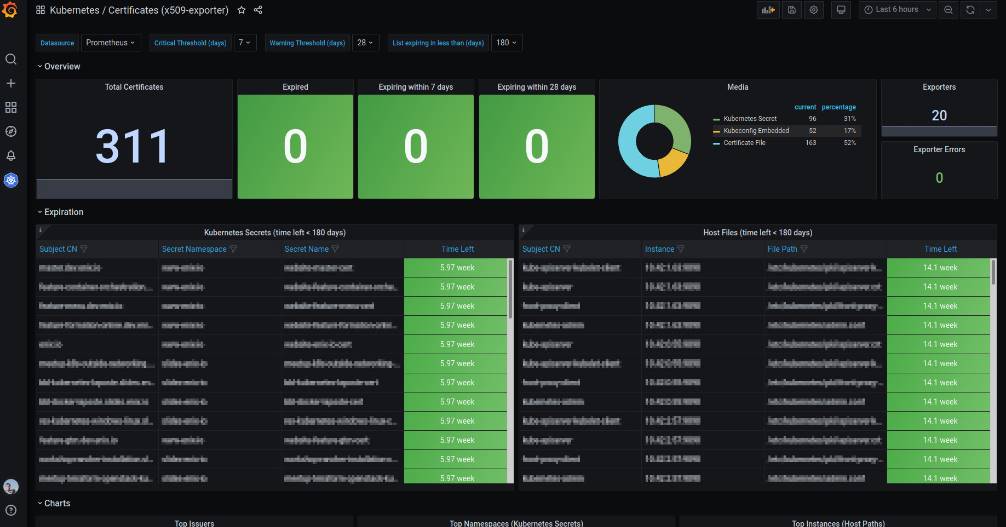
Monitor the effect
The Exporter also offers a fancy Grafana Dashboard, as follows:
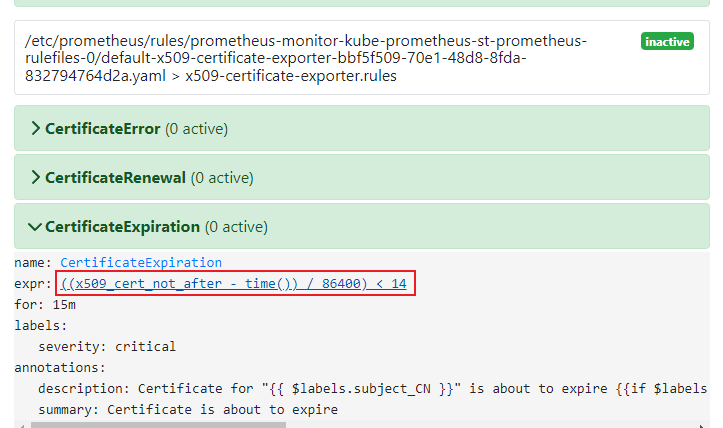
Alert Rules are as follows:
summary
In order to monitor the certificate expiration time of Kubernetes clusters, we provide 3 solutions, each with its own advantages and disadvantages:
- use Blackbox Exporter Monitor Kubernetes apiserver certificate expiration through Probe;
- Advantages: Simple implementation;
- Disadvantages: Only HTTPS certificates can be monitored;
- use kube-prometheus-stack Monitor the expiration time of relevant certificates through apiserver and kubelet components;
- Advantages: Out of the box, there is no need to install additional exporters after installing kube-prometheus-stack
- Disadvantages: Only apiserver and kubelet certificates can be monitored;
- use Enix’s x509-certificate-exporterMonitor all nodes in the cluster
/etc/kubernetes/pkiand/var/lib/kubeletand the kubeconfig file- Advantages: You can monitor all nodes, all kubeconfig files, and all secret certificates in tls format, if you want to monitor certificates outside of the Kubernetes cluster, you can also do the same; Wide and comprehensive range;
- Additional installation required: x509-certificate-exporter, corresponding to 1 Deployment and multiple DaemonSets, which consumes a lot of resources in the Kubernetes cluster.
You can choose flexibly according to your actual situation.
🎉🎉🎉
📚️ Reference documentation
- How do I monitor URLs using Blackbox Exporter? - Dongfeng Weiming Technology Blog (e-whisper.com)
- Prometheus Operator and kube-prometheus II - How to Monitor a 1.23+ kubeadm Cluster - Dongfeng Weiming Technology Blog (e-whisper.com)
- x509-certificate-exporter/deploy/charts/x509-certificate-exporter at master · enix/x509-certificate-exporter (github.com)