Prometheus Operator vs. kube-prometheus bis - how to monitor 1.23+ kubeadm clusters
This article was last updated on: February 7, 2024 pm
Brief introduction
- Series: Tags - Prometheus - Dongfeng Weiming Technology Blog (e-whisper.com)
- Previous article of Prometheus Operator: Prometheus Operator and one of kube-prometheus - Introduction - Dongfeng Weiming Technology Blog (e-whisper.com)
kube-prometheus-stackBundled with Prometheus Operator, Exporter, Rule, Grafana, and AlertManager needed to monitor Kubernetes clusters.
But for usekubeadmThe built Kubernetes cluster is still necessary to customize the Helm installation.
This time combined with the recent newer Kubernetes version v1.23+, and the more common installation methods kubeadm, to the actual combat description:
- What special configurations are required for kubeadm
- How to install Prometheus Operator: Pass kube-prometheus-stack helm chart
- How to configure component monitoring for a cluster where kubeadm is installed
Begin!
Prerequisites
- kubeadm
- helm3
What special configurations are required for kubeadm
In order to obtain the metrics of the Kubernetes v1.23+ cluster built by kubeadm normally through Prometheus Operator later, you need to make some special configurations for kubeadm.
By default, Kubeadm binds several of its management components to Node localhost 127.0.0.1 Addresses, involved: Kube Controller Manager, Kube Proxy and Kube Scheduler.
However, for monitoring, we need exposure of these endpoints so that their metrics can be extracted by Prometheus. Therefore, we need to expose these components to their 0.0.0.0 address.
When logging in to the kubeadm master node, run the following modifications:
Controller Manager and Scheduler components
By default,kubeadm There are no disclosures of the two services we want to monitor (kube-controller-manager and kube-scheduler). So, to make the most of itkube-prometheus-stack Helm chart, we need to make some quick adjustments to the Kubernetes cluster. Later we will monitor kube-controller-manager and kube-scheduler, and we must expose their address ports to the cluster.
By default, kubeadm runs these pods on your host and binds to 127.0.0.1. There are several ways to change this. It is recommended to change these configurations using kubeadm config file。 The following is an example configuration:
1 | |
🐾Upper. .scheduler.extraArgs and .controllerManager.extraArgs。 So put kube-controller-manager and kube-scheduler The service is exposed to other components of the cluster.
Also, if you put Kubernetes core components as pods in the kube-system namespace, make sure to do sokube-prometheus-exporter-kube-scheduler and kube-prometheus-exporter-kube-controller-manager service (these 2 services were created by kube-prometheus-stack for Prometheus Operator to monitor these two components through ServiceMonitor).spec.selector The value is consistent with the value of the pods.
If you already have a Kubernetes with kubeadm deployed, you can directly listen to kube-controller-manager and kube-scheduler:
1 | |
Kube Proxy component
📝Notes:
In general, kube-proxy is always bound to all addresses, but correspondingmetricsBindAddressIt may not necessarily follow the configuration. Specifically, as shown in “Before Change” below
For the Kube Proxy component, after the installation using kubeadm is completed, you need to modify the configmap kube-proxy under kube-system metricsBindAddress.
The changes are as follows:
Before the change:
1 | |
After the change:
1 | |
And reboot:
1 | |
etcd configuration
etcd configuration, which will not be detailed here, can be directly read: Prometheus Operator monitors etcd clusters - Yang Ming’s blog
But the method mentioned in the above link is more troublesome, recommend a simpler one: you can add a flag to listen to the Metrics URL in the configuration of etcd:
1 | |
Verify the kubeadm configuration
To summarize, through these previous configurations, the Metrics listening ports of the Kubernetes component are:
- Controller Manager: (Kubernetes v1.23+)
- Port: 10257
- Protocol: https
- Scheduler: (Kubernetes v1.23+)
- Port: 10259
- Protocol: https
- Kube Proxy
- Port: 10249
- Protocol: http
- etcd
- Port: 2381
- Protocol: http
Can pass netstat Command to check whether all previous configurations take effect:
Execute on master and etcd node:
1 | |
Install and customize Helm Values via kube-prometheus-stack
Here’s the 2 steps mentioned above directly:
- How to install Prometheus Operator: Pass kube-prometheus-stack helm chart
- How to configure component monitoring for a cluster where kubeadm is installed
Before we can install kube-prometheus-stack with Helm, we need to create onevalues.yamlto adjust the default chart value of the kubeadm cluster.
Configure persistent storage for Prometheus and AlertManager
It is recommended to configure persistent storage for Prometheus and AlertManager instead of using emptyDir.
The specific configuration of storage depends on the actual situation of your cluster, so I will not introduce it too much here.
etcd related configuration
The port monitored by Kubeadm etcd is 2381 (not specified in the Helm chart.)Default value: 2379)], so we need to explicitly override this value.
1 | |
Controller Manger related configuration
There is not much configuration to be done here, regarding https and ports, if the relevant key is empty or not set, the value will be dynamically determined based on the target Kubernetes version, due to the change in the default port in Kubernetes 1.22. Note the following: .kubeControllerManager.service.port and .kubeControllerManager.service.targetPort and .kubeControllerManager.serviceMonitor.https and .kubeControllerManager.serviceMonitor.insecureSkipVerify.
If the monitoring cannot be caught or there is an abnormality after configuration, it can be adjusted according to the actual situation.
1 | |
Kubernetes Scheduler
Ditto, there is not much configuration to be done here, regarding https and ports, if the relevant key is empty or not set, the value will be dynamically determined based on the target Kubernetes version, due to the change of the default port in Kubernetes 1.23. Note the following: .kubeScheduler.service.port and .kubeScheduler.service.targetPort and .kubeScheduler.serviceMonitor.https and .kubeScheduler.serviceMonitor.insecureSkipVerify.
If the monitoring cannot be caught or there is an abnormality after configuration, it can be adjusted according to the actual situation.
1 | |
Kubernetes Proxy
The same is true, adjusted according to whether https and port, as follows:
1 | |
Install kube-prometheus-stack via Helm
To add a Helm repository:
1 | |
Installation:
1 | |
verify
Here it is mainly verified whether the Kubernetes components of kubeadm are monitored normally, which can be verified by direct viewing through Prometheus UI or Grafana UI.
The Prometheus UI or Grafana UI address can be exposed via Ingress or NodePort, and then accessed:
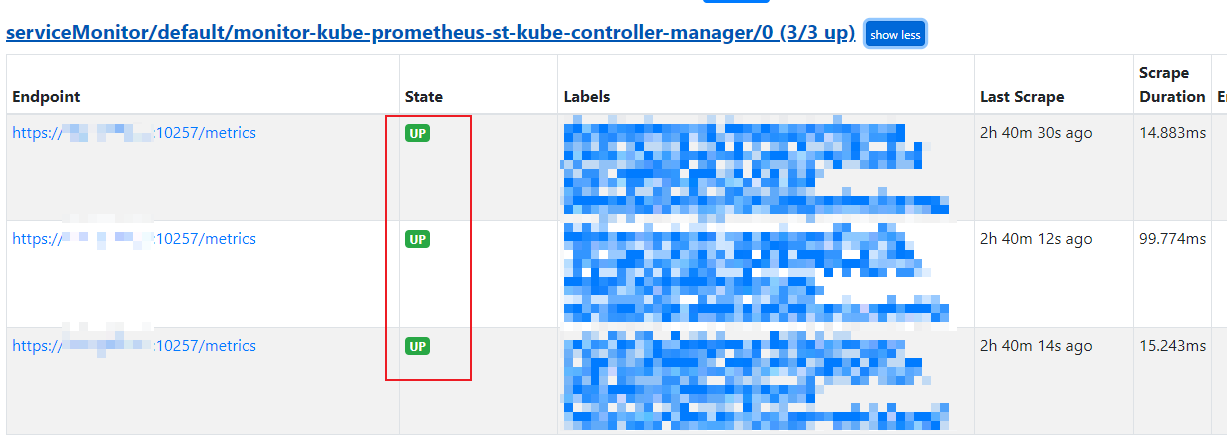
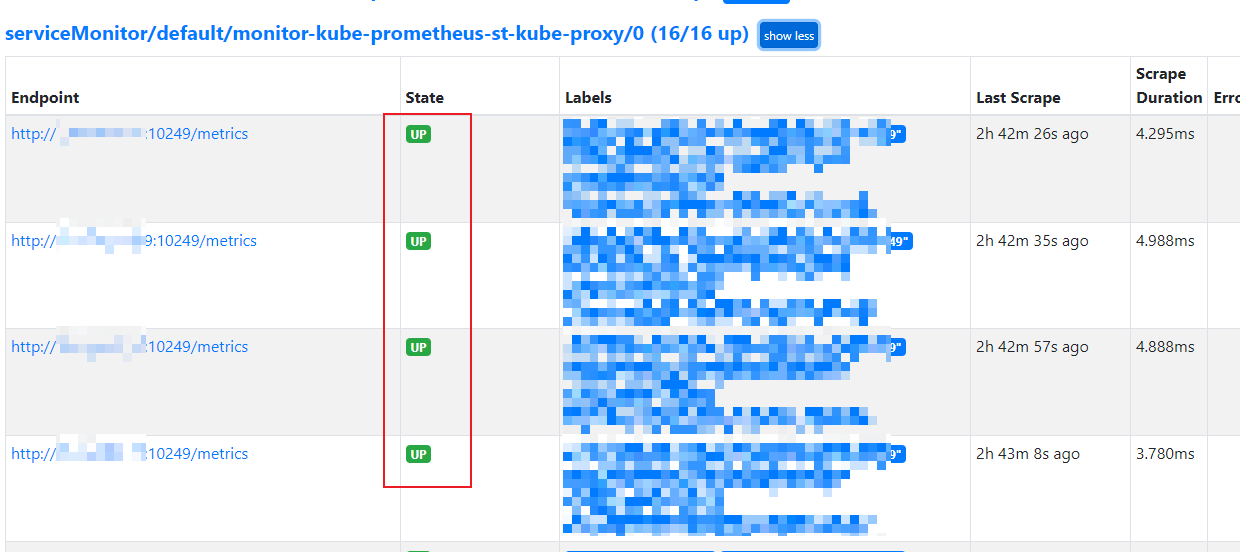
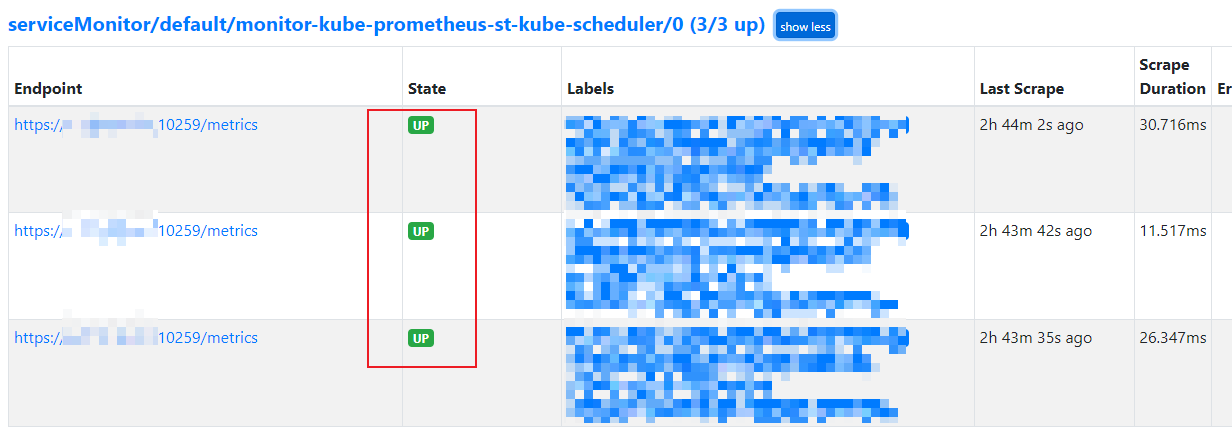
Status -> Targets To view the monitoring status, here are a few components to illustrate:
Grafana can directly log in to view the corresponding dashboard, as shown below:
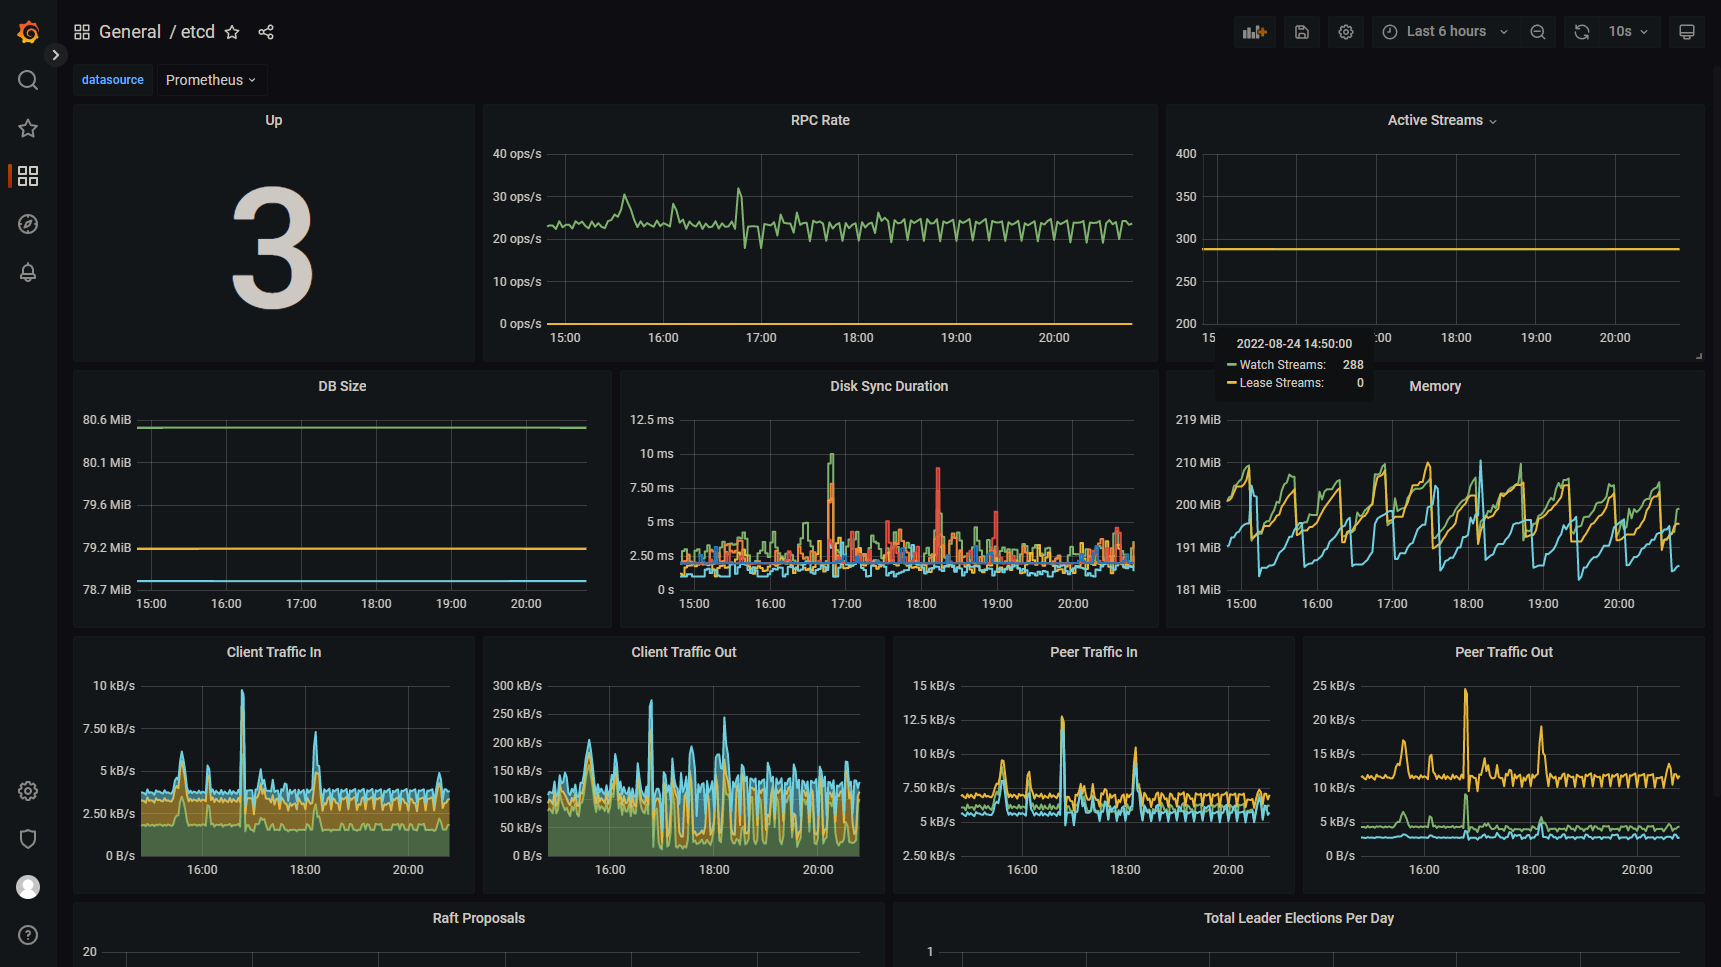
🎉🎉🎉
📚️ Reference documentation
- helm-charts/charts/kube-prometheus-stack at main · prometheus-community/helm-charts (github.com)
- Deploy to kubeadm - Prometheus Operator (prometheus-operator.dev)
- Prometheus Operator monitors etcd clusters - Yang Ming’s blog
- Prometheus: installing kube-prometheus-stack on a kubeadm cluster | Fabian Lee : Software Engineer