How to streamline Prometheus' metrics and storage footprint

This article was last updated on: February 7, 2024 pm

preface

As Prometheus monitors more and more components, numbers, and metrics, Prometheus will have higher requirements for computing performance and more storage usage.

In this case, to optimize Prometheus performance, optimize the storage footprint. The first thing that comes to mind may be a variety of Prometheus-compatible storage solutions, such as Thanos or VM, Mimir, etc. However, in fact, although centralized storage, long-term storage, storage downsampling and storage compression can solve related problems to a certain extent, they do not cure the symptoms.

  • The real cost is that the amount of indicators (series) is too large.
  • The cure for the root cause should be to reduce the amount of indicators. There are 2 ways to do this:

This article focuses on the second approach: How do I streamline Prometheus’ metrics and storage footprint based on actual usage?

Ideas

  1. Analyze all metric names currently stored in Prometheus;
  2. All metric names used in the analysis and display session, i.e. all metrics used by Grafana’s Dashboards;
  3. Analyze all metric names used in the alarm process, that is, all indicators used in the Prometheus Rule configuration;
  4. (Optional) analyze all metric names used in the diagnostic environment, i.e. metrics that are frequently queried on the Prometheus UI;
  5. Pass relabel at metric_relabel_configs or write_relabel_configs only keep 2-4 indicators, thereby drastically reducing the amount of indicators that Prometheus needs to store.

To implement this idea, you can use Grafana Labs mimirtool Come and get it.

Here’s a before and after comparison of how amazing this is:

  1. Before streamlining: 270336 activity series
  2. Streamlined: 61055 active series
  3. Streamlining effect: Nearly 5x the streamlining rate!

Grafana Mimirtool

Grafana Mimir is a Prometheus long-term storage solution based on object storage, evolved from Cortex. The official claims to support hundreds of millions of series write storage and query.

Grafana Mimirtool is a utility released by Mimir that can be used alone.

Grafana Mimirtool supports extracting metrics from:

  • Grafana Dashboards in Grafana instances (via Grafana API)
  • Prometheus alerting and recording rules in Mimir instances
  • Grafana Dashboards JSON file
  • Prometheus notes YAML files for alerting and recording rules

Grafana Mimirtool can then compare these extracted metrics with the active series in a Prometheus or Cloud Prometheus instance and output one used Indicators and unused A list of metrics.

Prometheus streamlines indicators in action

hypothesis

Assume:

  • Install Prometheus via kube-prometheus-stack
  • Grafana is installed and used as a showcase terminal
  • The corresponding alarm rule is configured
  • Other than that, there are no other indicators that need to be preserved

precondition

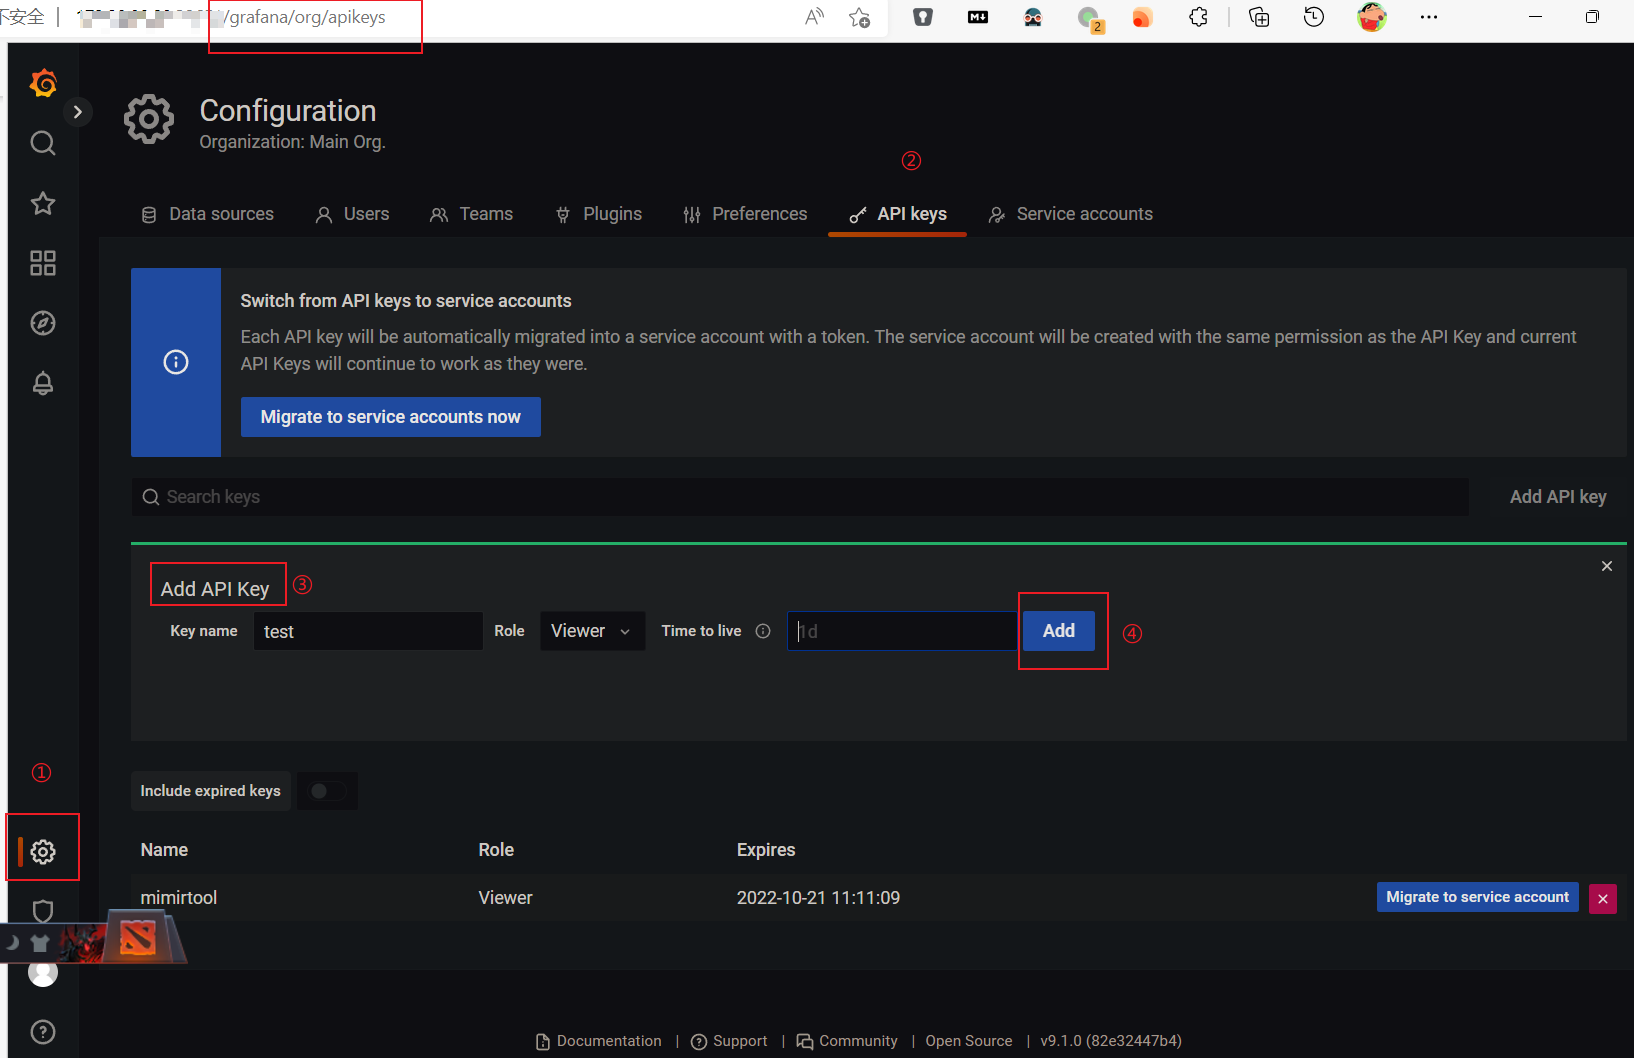
  1. Grafana Mimirtool Find the version of the platform corresponding to MimirTool from Releases and download it;
  2. alreadyCreate a Grafana API token
  3. PrometheusInstalled and configured.

Step 1: Analyze the metrics used by Grafana Dashboards

Through the Grafana API

The details are as follows:

1
2
3
# 通过 Grafana API 分析 Grafana 用到的指标 
# 前提是现在 Grafana 上创建 API Keys
mimirtool analyze grafana --address http://172.16.0.20:32651 --key=eyJrIjoiYjBWMGVoTHZTY3BnM3V5UzNVem9iWDBDSG5sdFRxRVoiLCJuIjoibWltaXJ0b29sIiwiaWQiOjF9

📝Illustrate:

  • http://172.16.0.20:32651 is the Grafana address
  • --key=eyJr is the Grafana API Token. It is obtained through the following interface:

创建 Grafana API Token

What was obtained was one metrics-in-grafana.json, which is outlined below:

1
2
3
4
5
6
7
8
9
10
11
12
13
14
15
16
17
18
19
20
21
22
23
24
25
26
27
28
29
30
31
32
33
34
35
36
37
38
39
40
41
42
43
44
45
46
47
48
49
50
51
52
53
54
55
56
57
58
59
60
61
62
63
64
65
{
"metricsUsed": [
":node_memory_MemAvailable_bytes:sum",
"alertmanager_alerts",
"alertmanager_alerts_invalid_total",
"alertmanager_alerts_received_total",
"alertmanager_notification_latency_seconds_bucket",
"alertmanager_notification_latency_seconds_count",
"alertmanager_notification_latency_seconds_sum",
"alertmanager_notifications_failed_total",
"alertmanager_notifications_total",
"cluster",
"cluster:namespace:pod_cpu:active:kube_pod_container_resource_limits",
"cluster:namespace:pod_cpu:active:kube_pod_container_resource_requests",
"cluster:namespace:pod_memory:active:kube_pod_container_resource_limits",
"cluster:namespace:pod_memory:active:kube_pod_container_resource_requests",
"cluster:node_cpu:ratio_rate5m",
"container_cpu_cfs_periods_total",
"container_cpu_cfs_throttled_periods_total",
"..."
],
"dashboards": [
{
"slug": "",
"uid": "alertmanager-overview",
"title": "Alertmanager / Overview",
"metrics": [
"alertmanager_alerts",
"alertmanager_alerts_invalid_total",
"alertmanager_alerts_received_total",
"alertmanager_notification_latency_seconds_bucket",
"alertmanager_notification_latency_seconds_count",
"alertmanager_notification_latency_seconds_sum",
"alertmanager_notifications_failed_total",
"alertmanager_notifications_total"
],
"parse_errors": null
},
{
"slug": "",
"uid": "c2f4e12cdf69feb95caa41a5a1b423d9",
"title": "etcd",
"metrics": [
"etcd_disk_backend_commit_duration_seconds_bucket",
"etcd_disk_wal_fsync_duration_seconds_bucket",
"etcd_mvcc_db_total_size_in_bytes",
"etcd_network_client_grpc_received_bytes_total",
"etcd_network_client_grpc_sent_bytes_total",
"etcd_network_peer_received_bytes_total",
"etcd_network_peer_sent_bytes_total",
"etcd_server_has_leader",
"etcd_server_leader_changes_seen_total",
"etcd_server_proposals_applied_total",
"etcd_server_proposals_committed_total",
"etcd_server_proposals_failed_total",
"etcd_server_proposals_pending",
"grpc_server_handled_total",
"grpc_server_started_total",
"process_resident_memory_bytes"
],
"parse_errors": null
},
{...}
]
}

Optionally, via the Grafana Dashboards json file

If you can’t create a Grafana API token, you can also use it for analysis as long as you have a Grafana Dashboards json file, as follows:

1
2
3
# 通过 Grafana Dashboard json 分析 Grafana 用到的指标 
mimirtool analyze dashboard grafana_dashboards/blackboxexporter-probe.json
mimirtool analyze dashboard grafana_dashboards/es.json

The resulting JSON structure is similar to the previous section, so I will not repeat it.

Step 2: Analyze the metrics used by Prometheus Alerting and Recording Rules

The specific operation is as follows:

1
2
3
4
5
# (可选) 通过 kubectl cp 将用到的 rule files 拷贝到本地 
kubectl cp <prompod>:/etc/prometheus/rules/<releasename>-kube-prometheus-st-prometheus-rulefiles-0 -c prometheus ./kube-prometheus-stack/rulefiles/

# 通过 Prometheus rule files 分析 Prometheus Rule 用到的指标 (涉及 recording rule 和 alert rules)
mimirtool analyze rule-file ./kube-prometheus-stack/rulefiles/*

The results are as follows metrics-in-ruler.json:

1
2
3
4
5
6
7
8
9
10
11
12
13
14
15
16
17
18
19
20
21
22
23
24
25
26
27
28
29
30
31
32
33
34
35
36
37
38
39
40
41
42
{
"metricsUsed": [
"ALERTS",
"aggregator_unavailable_apiservice",
"aggregator_unavailable_apiservice_total",
"apiserver_client_certificate_expiration_seconds_bucket",
"apiserver_client_certificate_expiration_seconds_count",
"apiserver_request_terminations_total",
"apiserver_request_total",
"blackbox_exporter_config_last_reload_successful",
"..."
],
"ruleGroups": [
{
"namspace": "default-monitor-kube-prometheus-st-kubernetes-apps-ae2b16e5-41d8-4069-9297-075c28c6969e",
"name": "kubernetes-apps",
"metrics": [
"kube_daemonset_status_current_number_scheduled",
"kube_daemonset_status_desired_number_scheduled",
"kube_daemonset_status_number_available",
"kube_daemonset_status_number_misscheduled",
"kube_daemonset_status_updated_number_scheduled",
"..."
]
"parse_errors": null
},
{
"namspace": "default-monitor-kube-prometheus-st-kubernetes-resources-ccb4a7bc-f2a0-4fe4-87f7-0b000468f18f",
"name": "kubernetes-resources",
"metrics": [
"container_cpu_cfs_periods_total",
"container_cpu_cfs_throttled_periods_total",
"kube_node_status_allocatable",
"kube_resourcequota",
"namespace_cpu:kube_pod_container_resource_requests:sum",
"namespace_memory:kube_pod_container_resource_requests:sum"
],
"parse_errors": null
},
{...}
]
}

Step 3: Analyze indicators that are not used

The details are as follows:

1
2
# 综合分析 Prometheus 采集到的 VS. (展示 (Grafana Dashboards) + 记录及告警 (Rule files))
mimirtool analyze prometheus --address=http://172.16.0.20:30090/ --grafana-metrics-file="metrics-in-grafana.json" --ruler-metrics-file="metrics-in-ruler.json"

📝Illustrate:

  • --address=http://172.16.0.20:30090/ is the prometheus address
  • --grafana-metrics-file="metrics-in-grafana.json" The json file obtained for the first step
  • --ruler-metrics-file="kube-prometheus-stack-metrics-in-ruler.json" The JSON file obtained for the second step

Output the resultprometheus-metrics.json As follows:

1
2
3
4
5
6
7
8
9
10
11
12
13
14
15
16
17
18
19
20
21
22
23
24
25
26
27
28
29
30
31
32
33
34
35
36
37
38
39
40
41
42
43
44
45
46
47
48
49
50
51
52
53
54
55
56
57
58
59
60
61
62
63
64
65
66
67
68
69
70
71
72
73
74
75
76
77
78
79
80
81
82
83
84
{
"total_active_series": 270336,
"in_use_active_series": 61055,
"additional_active_series": 209281,
"in_use_metric_counts": [
{
"metric": "rest_client_request_duration_seconds_bucket",
"count": 8855,
"job_counts": [
{
"job": "kubelet",
"count": 4840
},
{
"job": "kube-controller-manager",
"count": 1958
},
{...}
]
},
{
"metric": "grpc_server_handled_total",
"count": 4394,
"job_counts": [
{
"job": "kube-etcd",
"count": 4386
},
{
"job": "default/kubernetes-ebao-ebaoops-pods",
"count": 8
}
]
},
{...}
],
"additional_metric_counts": [
{
"metric": "rest_client_rate_limiter_duration_seconds_bucket",
"count": 81917,
"job_counts": [
{
"job": "kubelet",
"count": 53966
},
{
"job": "kube-proxy",
"count": 23595
},
{
"job": "kube-scheduler",
"count": 2398
},
{
"job": "kube-controller-manager",
"count": 1958
}
]
},
{
"metric": "rest_client_rate_limiter_duration_seconds_count",
"count": 7447,
"job_counts": [
{
"job": "kubelet",
"count": 4906
},
{
"job": "kube-proxy",
"count": 2145
},
{
"job": "kube-scheduler",
"count": 218
},
{
"job": "kube-controller-manager",
"count": 178
}
]
},
{...}
]
}

Step 4: Only keep Metrics used

If you have used remote_write, then directly in write_relabel_configs Link configuration keep Relabel rules, simple and crude.

You can use it first jp The command gets all that is needed keep metric name:

1
2
3
4
5
jq '.metricsUsed' metrics-in-grafana.json \
| tr -d '", ' \
| sed '1d;$d' \
| grep -v 'grafanacloud*' \
| paste -s -d '|' -

The output looks similar to the following:

instance:node_cpu_utilisation:rate1m|instance:node_load1_per_cpu:ratio|instance:node_memory_utilisation:ratio|instance:node_network_receive_bytes_excluding_lo:rate1m|instance:node_network_receive_drop_excluding_lo:rate1m|instance:node_network_transmit_bytes_excluding_lo:rate1m|instance:node_network_transmit_drop_excluding_lo:rate1m|instance:node_vmstat_pgmajfault:rate1m|instance_device:node_disk_io_time_seconds:rate1m|instance_device:node_disk_io_time_weighted_seconds:rate1m|node_cpu_seconds_total|node_disk_io_time_seconds_total|node_disk_read_bytes_total|node_disk_written_bytes_total|node_filesystem_avail_bytes|node_filesystem_size_bytes|node_load1|node_load15|node_load5|node_memory_Buffers_bytes|node_memory_Cached_bytes|node_memory_MemAvailable_bytes|node_memory_MemFree_bytes|node_memory_MemTotal_bytes|node_network_receive_bytes_total|node_network_transmit_bytes_total|node_uname_info|up

And then directly in write_relabel_configs Link configuration keep Relabel rules:

1
2
3
4
5
6
7
8
9
remote_write:
- url: <remote_write endpoint>
basic_auth:
username: < 按需 >
password: < 按需 >
write_relabel_configs:
- source_labels: [__name__]
regex: instance:node_cpu_utilisation:rate1m|instance:node_load1_per_cpu:ratio|instance:node_memory_utilisation:ratio|instance:node_network_receive_bytes_excluding_lo:rate1m|instance:node_network_receive_drop_excluding_lo:rate1m|instance:node_network_transmit_bytes_excluding_lo:rate1m|instance:node_network_transmit_drop_excluding_lo:rate1m|instance:node_vmstat_pgmajfault:rate1m|instance_device:node_disk_io_time_seconds:rate1m|instance_device:node_disk_io_time_weighted_seconds:rate1m|node_cpu_seconds_total|node_disk_io_time_seconds_total|node_disk_read_bytes_total|node_disk_written_bytes_total|node_filesystem_avail_bytes|node_filesystem_size_bytes|node_load1|node_load15|node_load5|node_memory_Buffers_bytes|node_memory_Cached_bytes|node_memory_MemAvailable_bytes|node_memory_MemFree_bytes|node_memory_MemTotal_bytes|node_network_receive_bytes_total|node_network_transmit_bytes_total|node_uname_info|up
action: keep

If not used remote_write, then only in metric_relabel_configs The link is configured.

Take the etcd job as an example: (Take the prometheus configuration as an example, Prometheus Operator please adjust it as needed)

1
2
3
4
5
6
7
8
9
10
11
12
13
14
15
16
17
18
19
20
21
22
- job_name: serviceMonitor/default/monitor-kube-prometheus-st-kube-etcd/0
honor_labels: false
kubernetes_sd_configs:
- role: endpoints
namespaces:
names:
- kube-system
scheme: https
tls_config:
insecure_skip_verify: true
ca_file: /etc/prometheus/secrets/etcd-certs/ca.crt
cert_file: /etc/prometheus/secrets/etcd-certs/healthcheck-client.crt
key_file: /etc/prometheus/secrets/etcd-certs/healthcheck-client.key
relabel_configs:
- source_labels:
- job
target_label: __tmp_prometheus_job_name
- ...
metric_relabel_configs:
- source_labels: [__name__]
regex: etcd_disk_backend_commit_duration_seconds_bucket|etcd_disk_wal_fsync_duration_seconds_bucket|etcd_mvcc_db_total_size_in_bytes|etcd_network_client_grpc_received_bytes_total|etcd_network_client_grpc_sent_bytes_total|etcd_network_peer_received_bytes_total|etcd_network_peer_sent_bytes_total|etcd_server_has_leader|etcd_server_leader_changes_seen_total|etcd_server_proposals_applied_total|etcd_server_proposals_committed_total|etcd_server_proposals_failed_total|etcd_server_proposals_pending|grpc_server_handled_total|grpc_server_started_total|process_resident_memory_bytes|etcd_http_failed_total|etcd_http_received_total|etcd_http_successful_duration_seconds_bucket|etcd_network_peer_round_trip_time_seconds_bucket|grpc_server_handling_seconds_bucket|up
action: keep

No keep while using drop

Same drop, no keep Instead, use drop It’s okay too. I won’t repeat it here.

🎉🎉🎉

summary

In this article, the requirements for streamlining the Prometheus indicator are presented, and then how to use it is explained mimirtool analyze command to determine the metrics used in Grafana Dashboards and Prometheus Rules. Then with analyze prometheus Analyzed in display and alarmused and unused The activity series, last configured with Prometheus only keep Metrics used.

Combined with this actual battle, the streamlining rate can reach about 5 times, and the effect is still very obvious. Recommended to give it a try. 👍️👍️👍️

📚️ Reference documentation