Prometheus Performance Tuning - What is the high base problem and how to solve it?
This article was last updated on: February 7, 2024 pm
background
Recently, I found that the performance of Prometheus for experiments has a bottleneck, and the following alarms often appear:
PrometheusMissingRuleEvaluationsPrometheusRuleFailures
After a slow investigation, it was found that it was caused by the high cardinality of some of Prometheus’ series. This article is a comprehensive summary of the Prometheus high cardinality problem.
What is cardinality?
CardinalBasic definitionRefers to the number of elements in a given set.
atPrometheusand observability in the world,Label cardinalityIt is very important because it affects the performance and resource usage of your monitoring system.
The following figure clearly reflects the importance of cardinality:
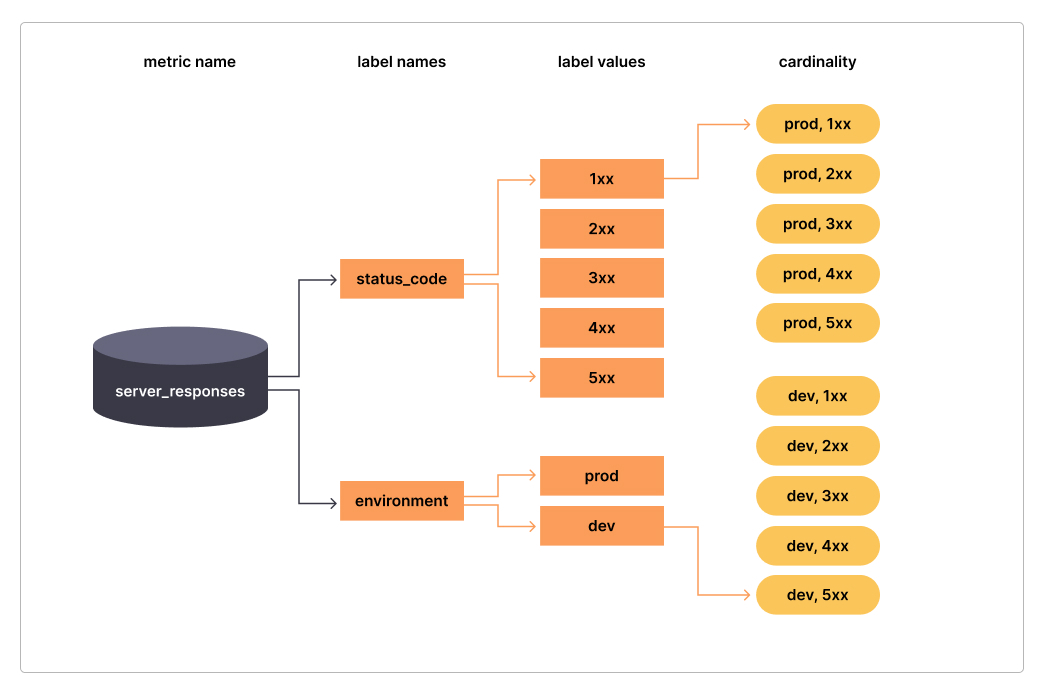
Simply put. Cardinality refers to the count of the population numeric value of a label. In the example above, labelsstatus_codeThe cardinality of is 5, (i.e.:1xx 2xx 3xx 4xx 5xx),environmentThe cardinality of is 2 (ieprod dev), and indicatorsserver_responsesThe overall cardinality is 10.
How much is a high cardinality?
Generally speaking:
- Lower cardinality 1:5 label-value ratio,
- Standard base 1:80 label-value ratio
- High cardinality 1:10000 label-value ratio.
Or the example above, if status_code is detailed code, such as200 404…, then its base may be as high as hundreds, environmentA little more base, indicatorsserver_responsesThe overall base will expand rapidly.
Typical case of high cardinality
This is not enough image, to give 2 more particularly typical examples:
- There is an indicator called:
http_request_duration_seconds_bucket- It has
instancelabel, corresponding to 100 instances; - Yes
lelabel, corresponding to different buckets, there are 10 buckets, such as (0.0020.0040.008…=+inf) - It still has
urlThis label, corresponding to the incomprehensible URL:- Even if the scale is small, the URL may have 400 URLs
- Another particularly scary pitfall here is that for large-scale systems, this URL may be nearinfinitude!!!
- It still has
http_methodThis label corresponds to 5 HTTP methods - In this case, the label of the indicator
- On a small scale, there will also be:
100*10*400*5=2 000 0002 million series 💀💀💀 - If the scale is almost infinite, then this cardinality cannot be calculated 💥💥💥 at all
- On a small scale, there will also be:
- It has
- There is another situation, will
user_idEvensession_id经纬度This kind of cardinality is very large, maybe even infinite parameters set to label, then it is a disaster 💥💥💥 for Prometheus
The negative effects of high cardinality
When Prometheus has a high cardinality, various problems arise:
- The monitoring system is unstable or even crashes
- The dashboard loads slowly or even fails
- Monitoring queries are slow or even failing
- Compute storage resources are expensive
- Surveillance is rife with a lot of noise distractions
- The SRE team had to deal with the massive amount of alarm data, which delayed the analysis and positioning of root cause
📝Notes:
Cardinality corresponds to the number of metrics series. So in this blog post, the number of series will be mentioned alternately with the cardinality.
How to analyze a high cardinality problem?
There are several ways to analyze high cardinality problems:
- Use Prometheus UI analytics
- Analysis using Prometheus PromQL
- Use the Prometheus API for analysis
- Use Grafana Mimirtool to analyze unused metrics
Use Prometheus UI analytics
From Prometheus v2.14.0 Later, there is directly on the UI Head Cardinality Stats This menu. This greatly facilitates the analysis of high cardinality problems! 👍️👍️👍️
Located at: Prometheus UI -> Status -> TSDB Status -> Head Cardinality Stats, screenshot below:
📝Notes:
The following screenshot illustrates the system scale: This is the environment I used to experiment, with only 4 1c2g nodes
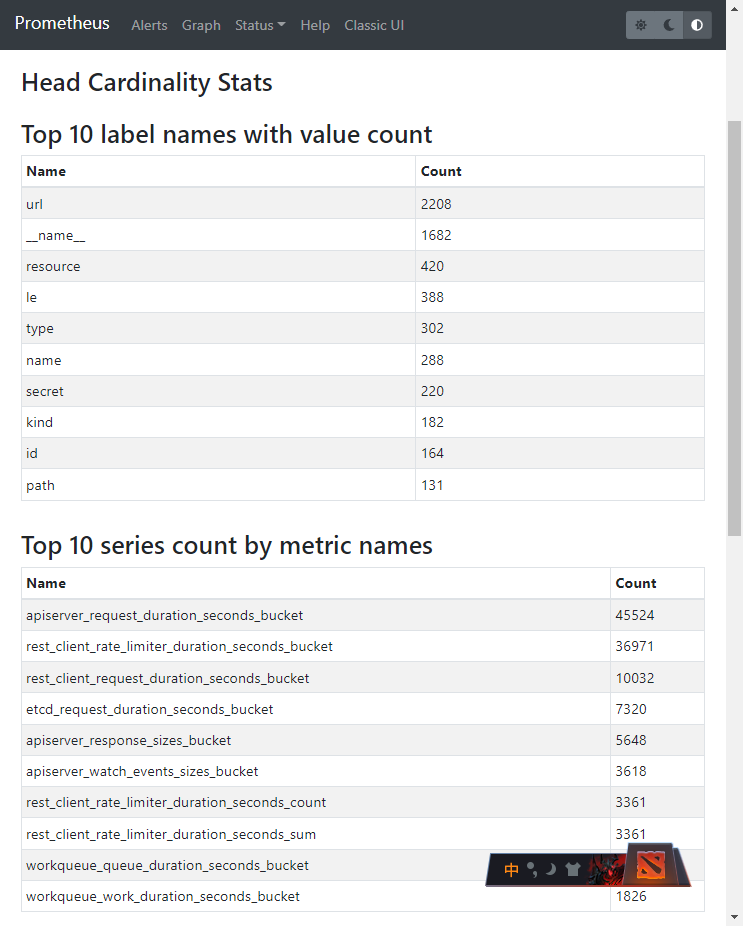
From the above figure, you can intuitively see:
- The label with the most values is
url - The indicators with the most series are:
apiserver_request_duration_seconds_bucket45524rest_client_rate_limiter_duration_seconds_bucket36971rest_client_request_duration_seconds_bucket10032
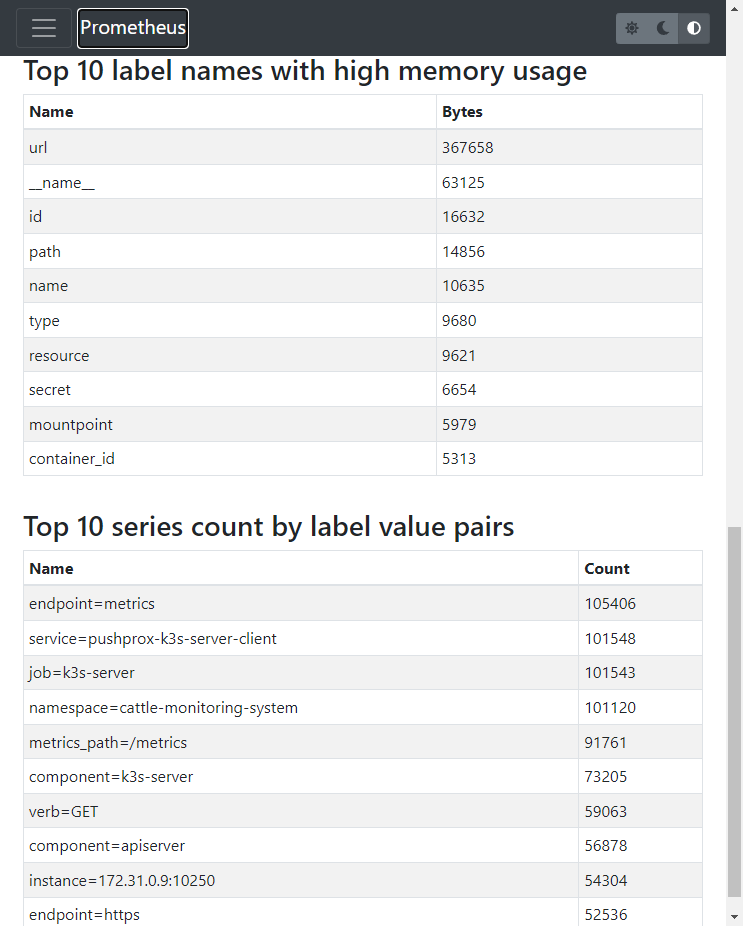
- Labels with the most memory usage:
url - According to the Label key-value pair match, the key-value pairs with the most series are: (This project was not very useful to me before)
endpoint=metrics105406service=pushprox-k3s-server-client101548job=k3s-server101543namespace=cattle-monitoring-system101120metrics_path=/metrics91761
Analysis using Prometheus PromQL
If the Prometheus version is lower v2.14.0, then you need to pass by:
- Prometheus PromQL
- Prometheus API
to analyze.
Here are some useful PromQLs:
1 | |
The corresponding query result is the above Top 10 with the most series indicators
Knowing the Top10, you can further query the details, because the cardinality is huge, if the query range may always fail, so it is recommended instant Way to query details.
If you want to query the dimensions of the label, you can do PromQL as follows:
1 | |
As:
1 | |
There are also some other PromQLs, listed below:
sum(scrape_series_added) by (job)Analyze series growth through job labelssum(scrape_samples_scraped) by (job)Analyze the total number of series through the job labelprometheus_tsdb_symbol_table_size_bytes
Use the Prometheus API for analysis
Because of the high cardinality problem, queries through Prometheus PromQL may often time out or fail. Then it can be analyzed through the Prometheus API:
Analyze the number of series for each metric
1 | |
The results of my own experimental cluster analysis top are as follows: (null may be no current data, but the amount of historical data may be large)
| Number of active series | Metric name |
|---|---|
| null | apiserver_admission_webhook_rejection_count |
| null | apiserver_registered_watchers |
| null | apiserver_request_aborts_total |
| null | apiserver_request_duration_seconds_bucket |
| null | cluster_quantile:scheduler_e2e_scheduling_duration_seconds:histogram_quantile |
| null | cluster_quantile:scheduler_scheduling_algorithm_duration_seconds:histogram_quantile |
| null | kube_pod_container_status_waiting_reason |
| null | prometheus_target_scrape_pool_target_limit |
| null | rest_client_rate_limiter_duration_seconds_bucket |
| 5786 | rest_client_request_duration_seconds_bucket |
| 3660 | etcd_request_duration_seconds_bucket |
| 2938 | rest_client_rate_limiter_duration_seconds_count |
| 2938 | rest_client_rate_limiter_duration_seconds_sum |
| 2840 | apiserver_response_sizes_bucket |
| 1809 | apiserver_watch_events_sizes_bucket |
Gets the activity series for the specified metric
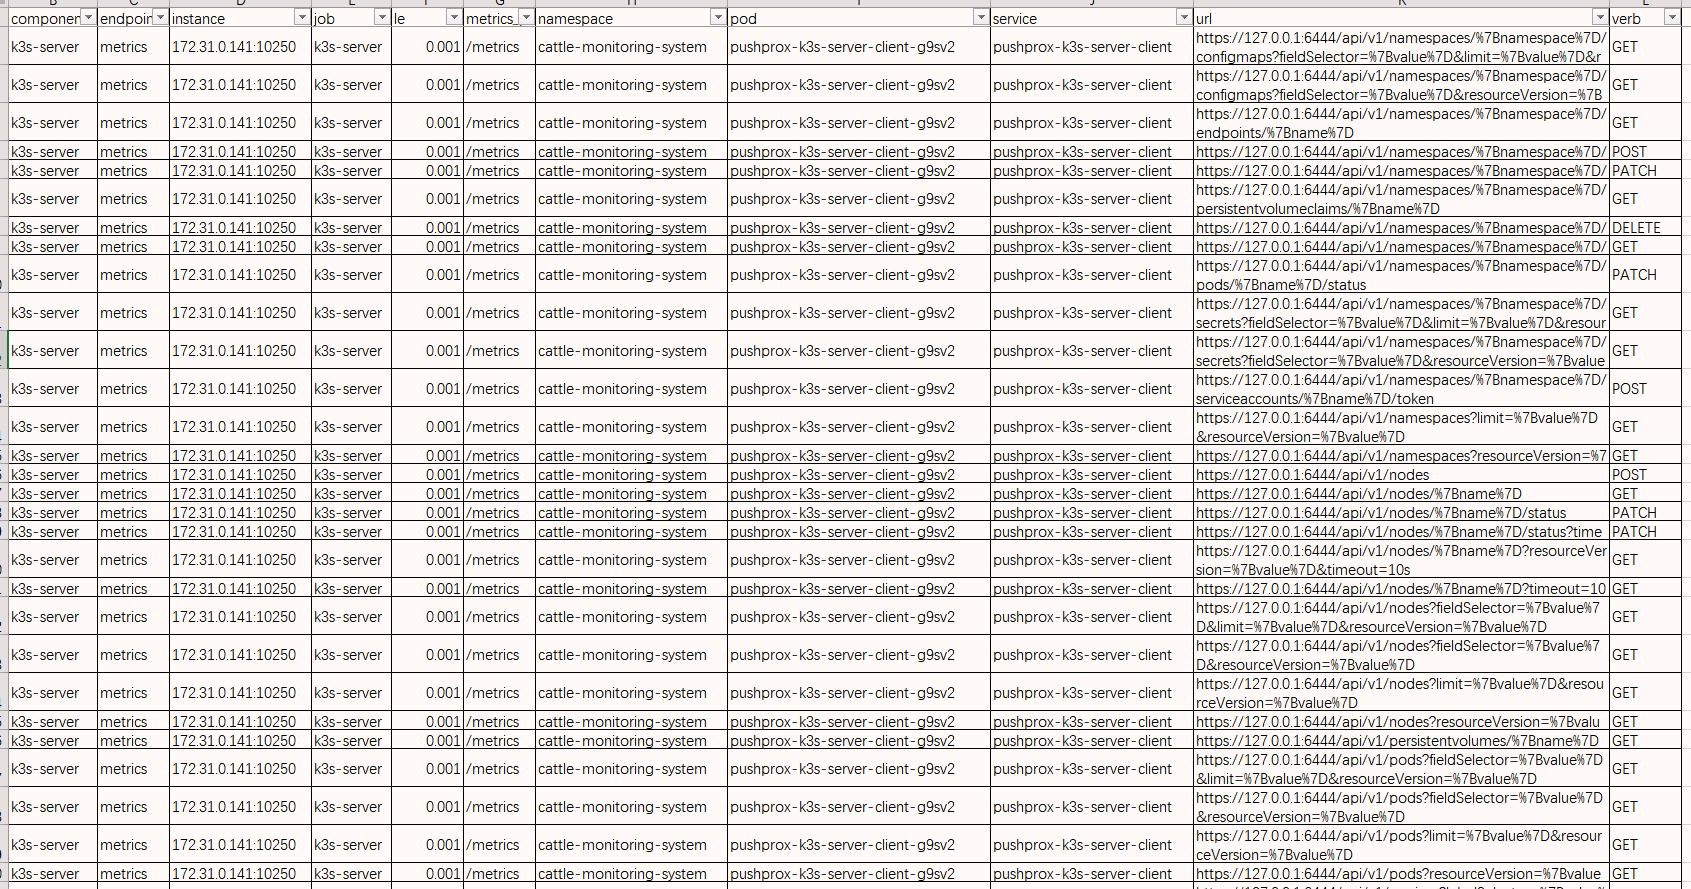
Here it is rest_client_request_duration_seconds_bucket Example:
1 | |
The result is as follows: (The main reason is that the URL has too much value)
Get a list of all metrics
1 | |
Gets a list of tags and their cardinality
1 | |
The result is as follows: (Again, because of label.) url Too much value! )
| Cardinality | Label |
|---|---|
| 2199 | url |
| 1706 | __name__ |
| 854 | name |
| 729 | id |
| 729 | path |
| 657 | filename |
| 652 | container_id |
| 420 | resource |
| 407 | le |
| 351 | secret |
| 302 | type |
| 182 | kind |
Use Grafana Mimirtool to analyze unused metrics
📚️Reference:
Grafana Mimir’s introduction can be found here: Intro to Grafana Mimir: The open source time series database that scales to 1 billion metrics & beyond | Grafana Labs
Mimir has a utility called Mimir mimirtoolIt is possible to analyze which indicators are not used by comparing the indicators of Prometheus with those used by AlertManager and Grafana. It can be analyzed by entering as follows:
- Grafana Dashboards for Grafana instances
- Recording rules and alerting rules for Prometheus instances
- Grafana Dashboard json file
- Prometheus recording and alerting rules YAML files
I won’t go into detail here, but the full introduction is here: Analyzing and reducing metrics usage with Grafana Mimirtool | Grafana Cloud documentation
Solve high cardinality problems
For high cardinality problems, there are several cases:
- Some labels are unreasonable, worth a lot or even infinity;
- Some indicators are unreasonable, there are many values;
- Prometheus’ entire series is too large
For the third problem, the following 2 solutions can be solved:
For high availability Prometheus high cardinality problems
There is a high cardinality situation where Prometheus is deployed in HA mode and passes remote_write way to send data to VM, Mimir, or Thanos.
In this case, you can add it according to the guidance of the official documentation for VM, Mimir, or Thanos external_labels For these software to automatically handle high cardinality problems.
An example configuration is as follows:
increaseexternal_labels
cluster__replicas__
Increase the acquisition interval
Add Prometheus global scrape_interval(Adjust this parameter globally, for some that really need a smaller acquisition interval, you can do it.) job detailed configuration)
Generally it may default to yes scrape_interval: 15s
It is recommended that you adjust its increase value to scrape_interval: 1m Even bigger.
Filter and persist kubernetes-mixin metrics
For projects such as kubernetes-mixin, Prometheus Operator, kube-prometheus, etc., something will be available out of the box:
- scrape metrics
- recording rules
- alerting rules
- Grafana Dashboards
In this case, according to Grafana Dashboards and alerting rules, the indicators used can be reserved by relabeling.
📚️Reference:
Examples are as follows:
1 | |
🐾Warning:
The above configuration may vary according to different versions, please refer to and use as appropriate.
Or according to the abovemimirtoolAnalyze and generate your own configuration.
Reduce the use of Prometheus metrics with Relabel
A simple example is as follows:
1 | |
Aggregate metrics through recording rules and use it with relabel drop
For example apiserver_request_duration_seconds_bucket, what I need is some high-latitude metrics - such as the availability of API Server, then these metrics can be recorded and stored through recording rules, example as follows:
1 | |
After that, it can be in again remote_wirte and other stages to delete the original indicator:
1 | |
💪💪💪
📚️ Reference documentation
- How to manage high cardinality metrics in a Prometheus environment (grafana.com)
- What are cardinality spikes and why do they matter? | Grafana Labs
- Containing your Cardinality
- Control Prometheus metrics usage | Grafana Cloud documentation
- Bomb Squad: Automatic Detection and Suppression of Prometheus Cardinality Explosions | by Cody Boggs | FreshTracks.io
- Feature: Expose a request path label in the
http_request_*metric by default · Issue #491 · prometheus/client_golang · GitHub