Grafana article series (IX): Introduction to Loki, the open source CloudNative logging solution
This article was last updated on: July 24, 2024 am
Brief introduction
About Grafana Labs
Grafana is the de facto dashboard solution for time series data. It supports nearly a hundred data sources.
Grafana Labs wanted to transform from a dashboard solution to an observability platform that would be the go-to place when you needed to debug your system.
Complete observability
Observability. There are many definitions of what this means. Observability is the visibility into your systems and their behavior and performance. Typical of this pattern, observability can be divided into three parts (or pillars): metrics, logs, and traces; Each section complements each other to help you quickly identify the problem.
Here’s a recurring chart from Grafana Labs’ blogs and talks:
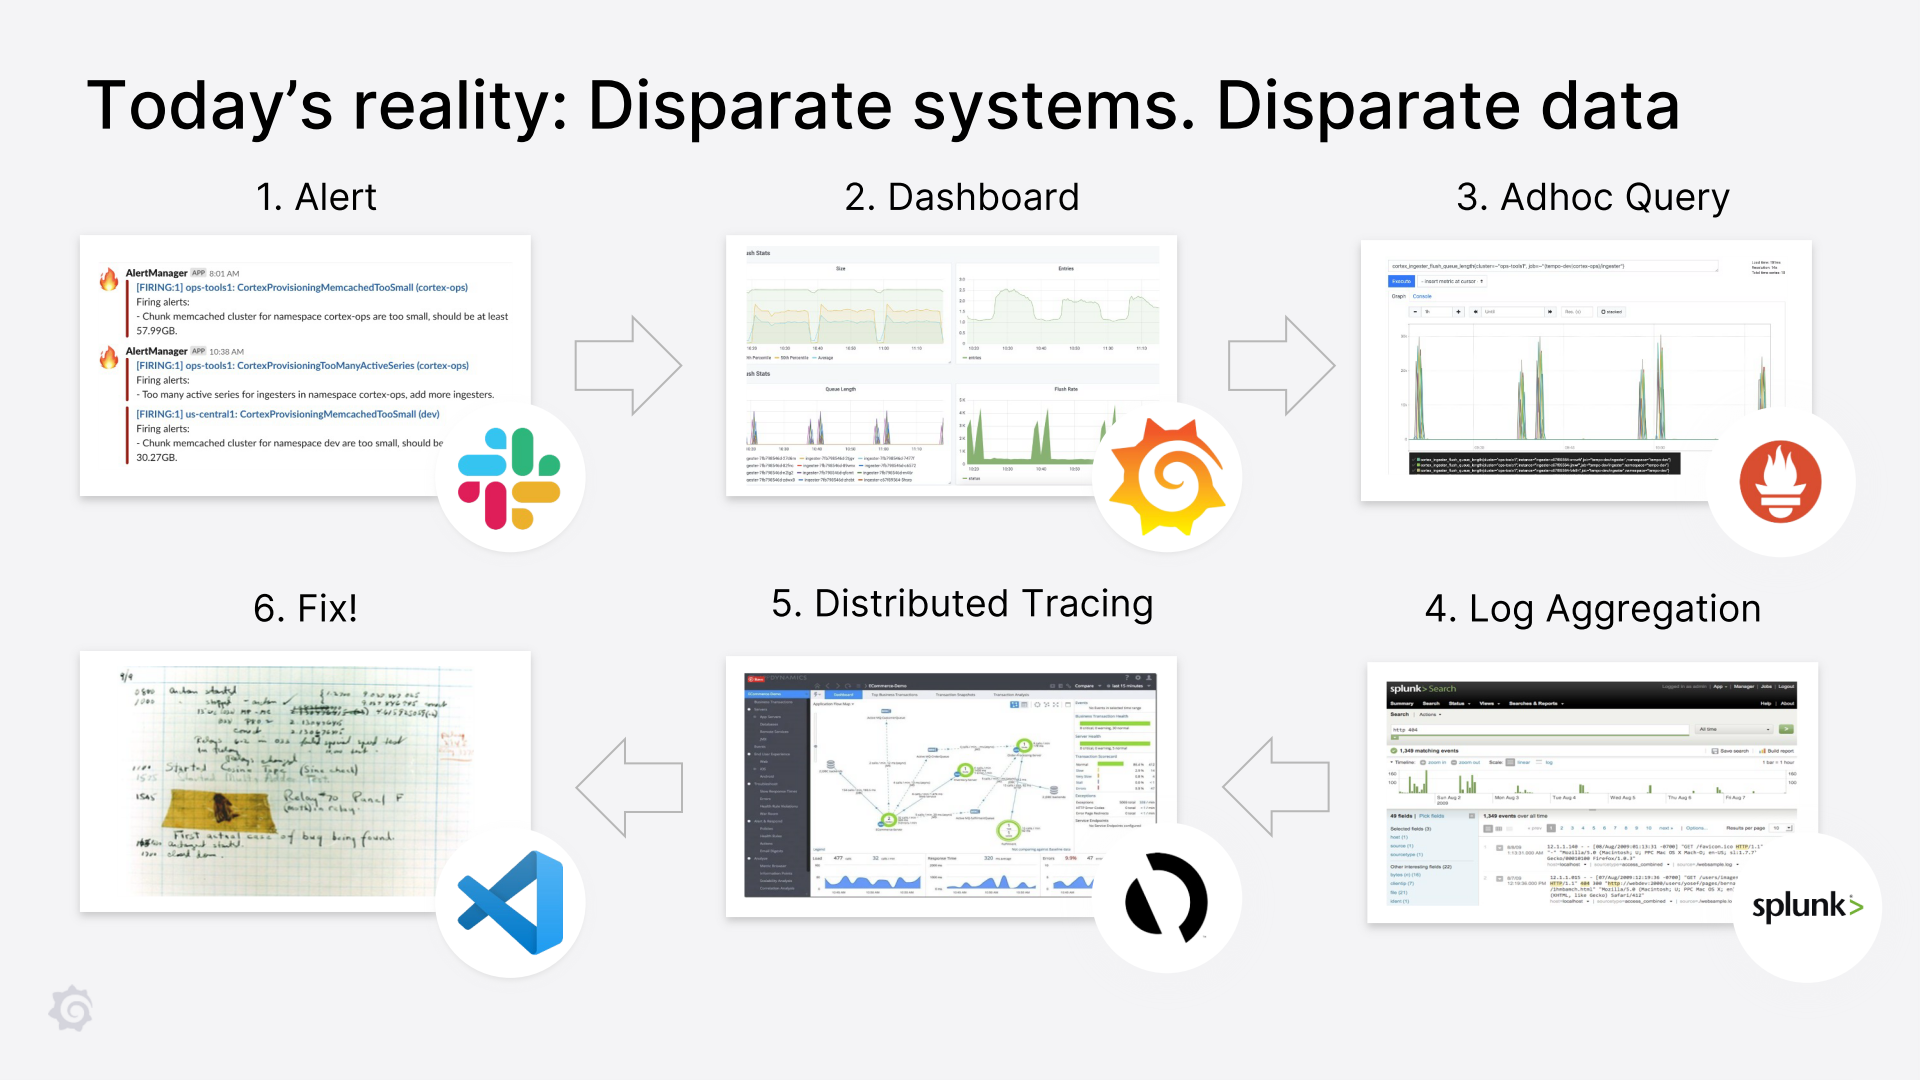
Slack alerted me that there was a problem, and I opened the dashboard for the service on Grafana. If I notice an anomaly in a panel or chart, I open a query in Prometheus’ user interface to dig deeper. For example, if I find that one of the services throws 500 errors, I try to find out if a particular handler/route is throwing the error, or if all instances are throwing the error, etc.
Next, once I have a vague mental model and know what went wrong, I look at the logs (like on splunk). Before Loki, I used to using kubectl to get the relevant logs and see what the error was and if I could do something about it. This works well for bugs, but sometimes I give up because of high latency. After that, I get more information from traces (like AppD) about what is slow and which method/operation/function is slow. Or use Jaeger to get tracking information.
While they don’t always tell me directly what went wrong, they usually let me look closely enough at the code and figure out what went wrong. I can then scale the service (if the service is overloaded) or deploy a fix.
Loki project background
Prometheus is working well, Jaeger is getting better, and kubectl is doing well. The label model was powerful enough to allow me to get to the root of the faulty service. If I find that the ingester service is failing, I will do:kubectl --namespace prod logs -l name=ingester | grep XXXto get the relevant logs and grep through them.
If I find that a particular instance is wrong, or I want to track logs for a service, I have to use a separate pod to track because kubectl doesn’t allow you to track based on tag selectors. This is not ideal, but it is doable for most use cases.
As long as the pod doesn’t crash or be replaced, that’s fine. If a pod or node is terminated, logs are lost forever. Also, kubectl only stores the most recent logs, so we are blind when we want logs from the day before or earlier. Also, having to jump from Grafana to CLI and back back wasn’t ideal. We needed a solution that would reduce context switching, and many of the solutions we explored were very expensive or didn’t scale well.
This is to be expected, as they do more than select + grep, which is exactly what we need. After looking at the existing solutions, Grafana Labs decided to build its own.
Loki
Unhappy with any open source solution, Grafana Labs started talking to people and found that many people had the same problem. In fact, Grafana Labs has realized that even today, many developers still log on SSH and grep/tail machines. The solutions they use are either too expensive or unstable enough. In fact, people were asked to reduce logs, which Grafana Labs considers to be an anti-pattern of logs. Grafana Labs believes it is possible to build something that can be used within Grafana Labs and by the wider open source community. Grafana Labs has one main goal:
- Keep it simple. Only grep is supported!

Grafana Labs also targets other goals:
- Logs should be cheap. No one should be asked to keep less logs.
- Easy to operate and expand
- Metrics, logs, and later traces need to work together
This last point is important. Grafana Labs already collected metadata for metrics from Prometheus, so wanted to use that metadata for log correlation. For example, Prometheus tags each metric with namespace, service name, instance IP, and so on. When an alert is received, metadata is used to figure out where to look for logs. If we manage to tag logs with the same metadata, we can seamlessly switch between metrics and logs. You can do it in Over here See the internal design documentation written by Grafana Labs. Here’s a link to Loki’s demo video:
Architecture
Based on Grafana Labs’ experience building and running Cortex – a horizontally scalable distributed version of Prometheus running as a service – the following architecture came up with:
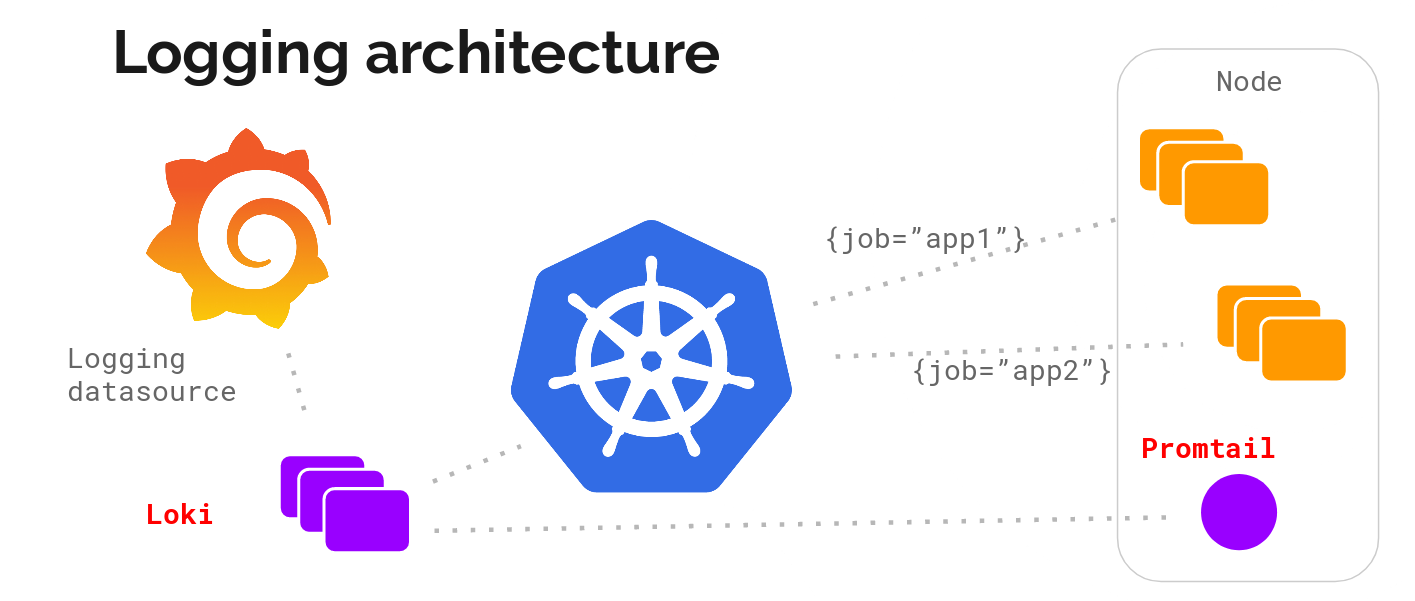
The metadata match between metrics and logs was critical to us, and Grafana Labs initially decided to target Kubernetes only. The idea is to run a log collection agent on each node, use it to collect logs, talk to Kubernetes’ APIs, figure out the correct metadata for the logs, and send them to a central service that can be used to display the logs collected within Grafana.
The agent supports the same configuration (relabelling rules) as Prometheus to ensure metadata matching. We call this proxy promtail.
Deep dive into Loki – a scalable log collection engine:
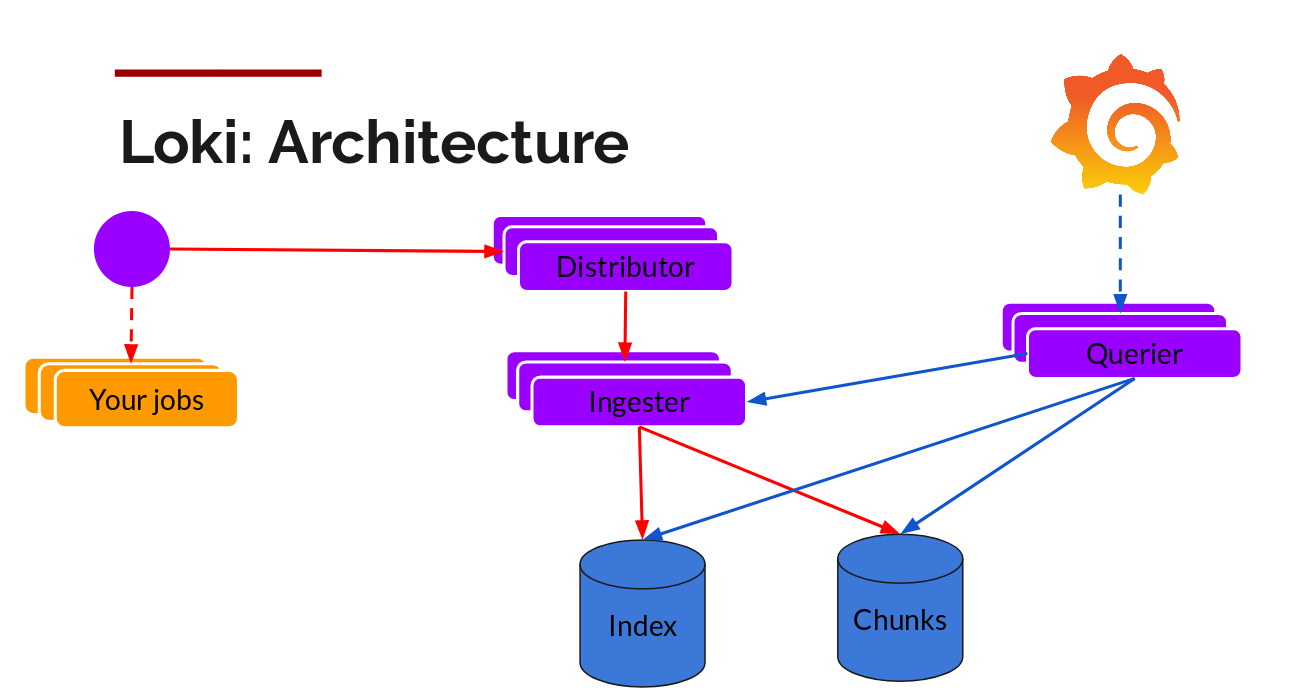
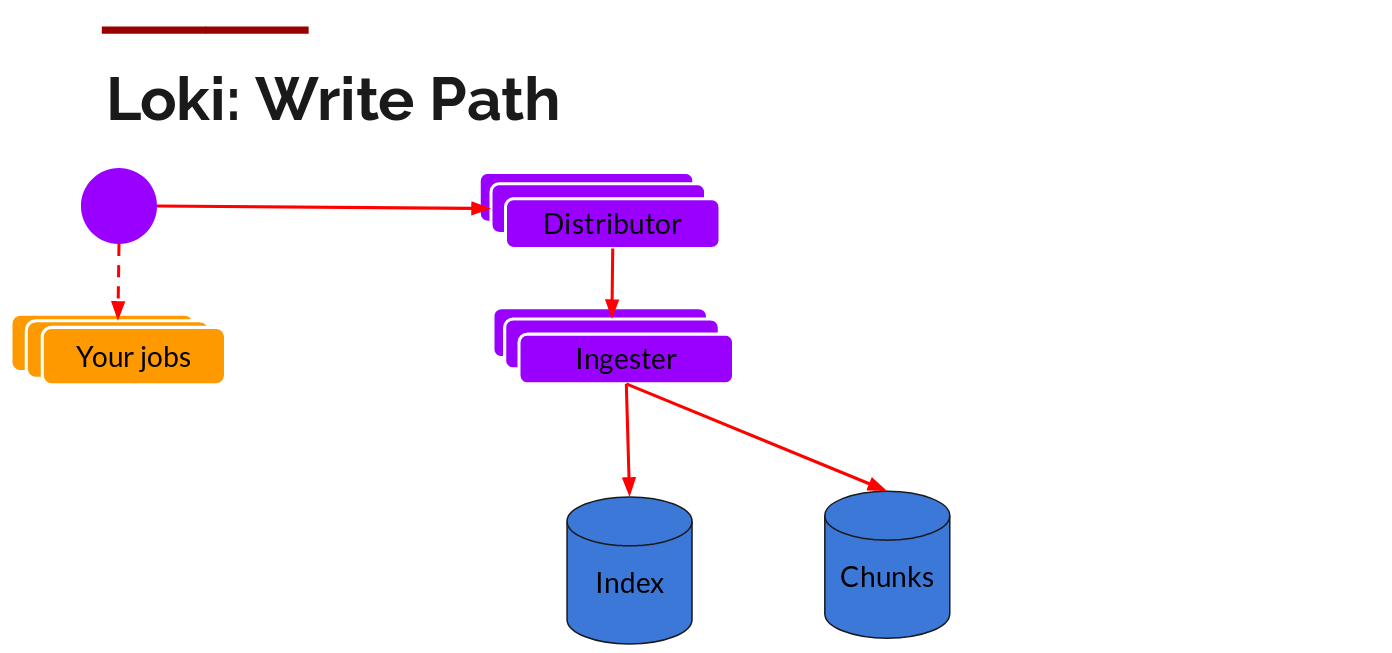
The write path and the read path (query) are decoupled from each other, and are explained separately:
Distributor
Once promtail collects and sends logs to Loki, Distributor is the first component to receive logs. Now, Loki probably receives millions of writes per second, and we don’t want to write them to the database as they come in. That would bring down any database. Data needs to be batched and compressed as it comes in.
Grafana Labs does this by building compressed chunks, which compress logs via gzip. The ingester component is a stateful component that is responsible for building blocks and then refreshing blocks. Loki has multiple ingesters, and logs belonging to each stream should always end in the same ingester because all related entries end in the same block. This is done by building an ingester ring and using a consistent hash. When an entry comes in, the Distributor hashes the tag of the log, and then looks up which ingester to send the entry to based on the hash value.
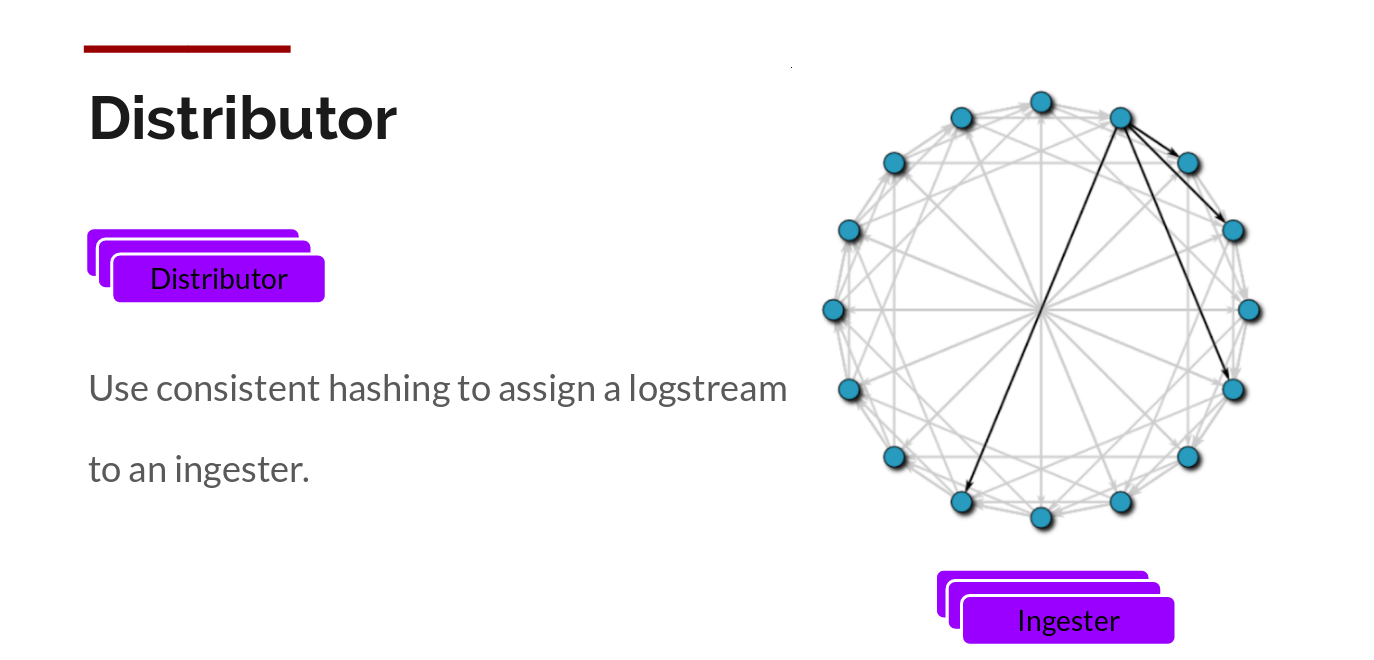
Also, for redundancy and resiliency, Loki replicated it n times (3 by default).
Ingester (collector)
Now, Ingester will receive the entry and start building blocks.
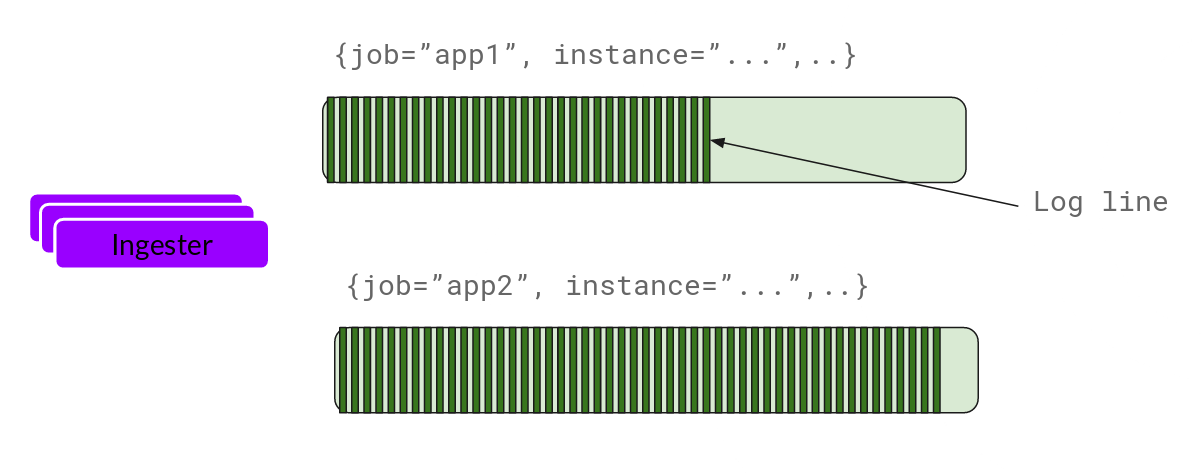
This is basically gzipping the log and appending it. Once the block is “filled”, we brush it into the database. We use different databases for blocks and indexes because the types of data they store are different.
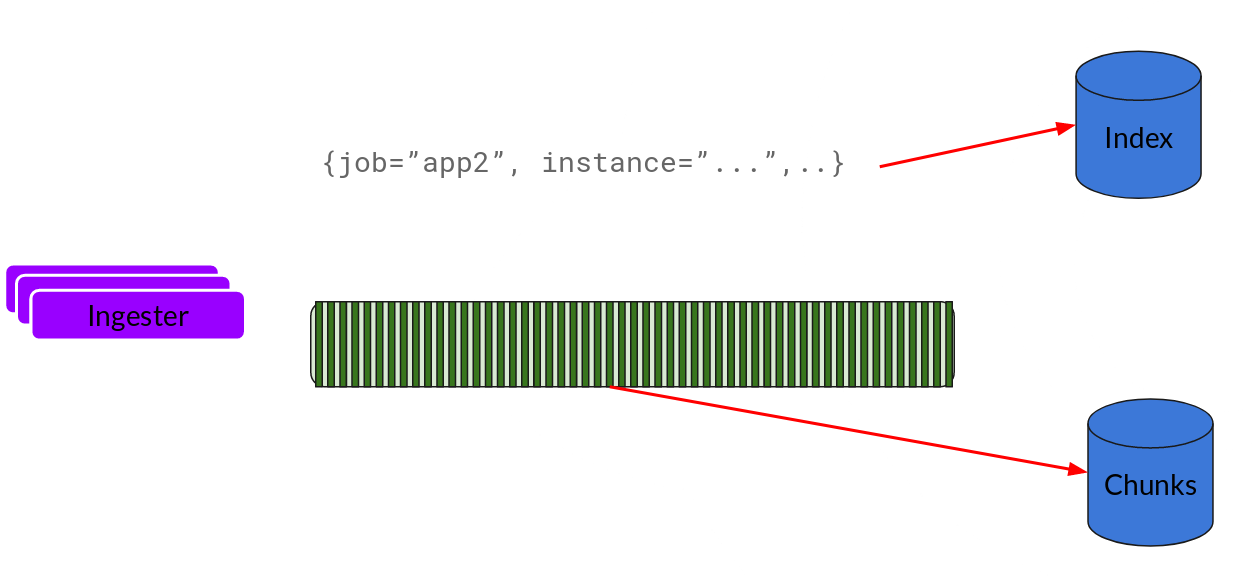
After flashing a block, Ingester creates a new empty block and adds a new entry to the block.
Querier (querier)
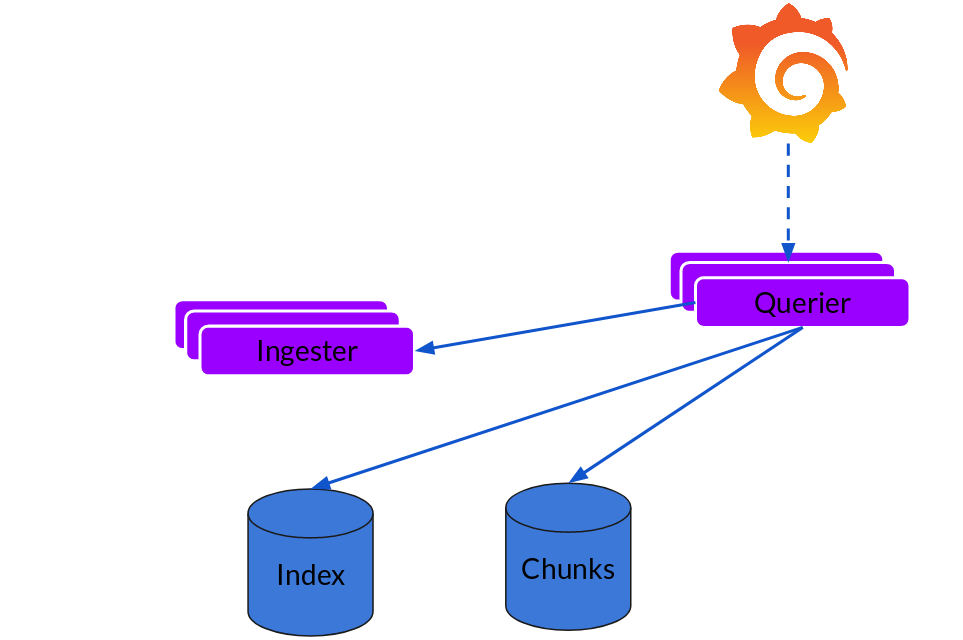
Reading the path is straightforward, and Querier does most of the heavy lifting. Given a time range and label selector, it looks at the index to find matching blocks and searches through them, giving you results. It also talks to ingesters to get the latest data that hasn’t been flashed to the library.
Note that in the 2019 release, for each query, an Ingester searches all relevant logs for you. Grafana Labs has already implemented query parallelism using a front-end in Cortex, and the same approach can be extended to Loki to provide distributed grep that will make large queries fast enough.
Scalability
- Loki puts the data in blocks into object storage so that it can be extended.
- Loki puts indexes into Cassandra/Bigtable/DynamoDB or Loki’s built-in index db, which is also scalable.
- Distributors and Queriers are stateless components that can scale out.
Speaking of ingester, it’s a stateful component, but Loki already includes the full lifecycle of sharding and resharding. When the rollout work is complete, or when the ingester is scaled up or down, the ring topology changes, and the ingester redistributes their blocks to match the new topology. This is mostly code taken from Cortex, which has been running in production for over 5 years.
summary
Loki: like Prometheus, but for logs.
Loki is a horizontally scalable, highly available, multi-tenant log aggregation system inspired by Prometheus. It is designed to be very cost-effective and easy to operate. Instead of indexing the contents of the logs, it provides a set of labels for each log stream.