Grafana Series (VII): Tracing in Grafana Explore
This article was last updated on: July 24, 2024 am
👉️URL: https://grafana.com/docs/grafana/latest/explore/trace-integration/
📝Description:
Tracing in Explore
Explore allows you to visualize the breadcrumbs of your tracing data source. This is available in Grafana v7.0+.
The supported data sources are:
For information on how to configure queries for these data sources, refer to the documentation for the specific data source.
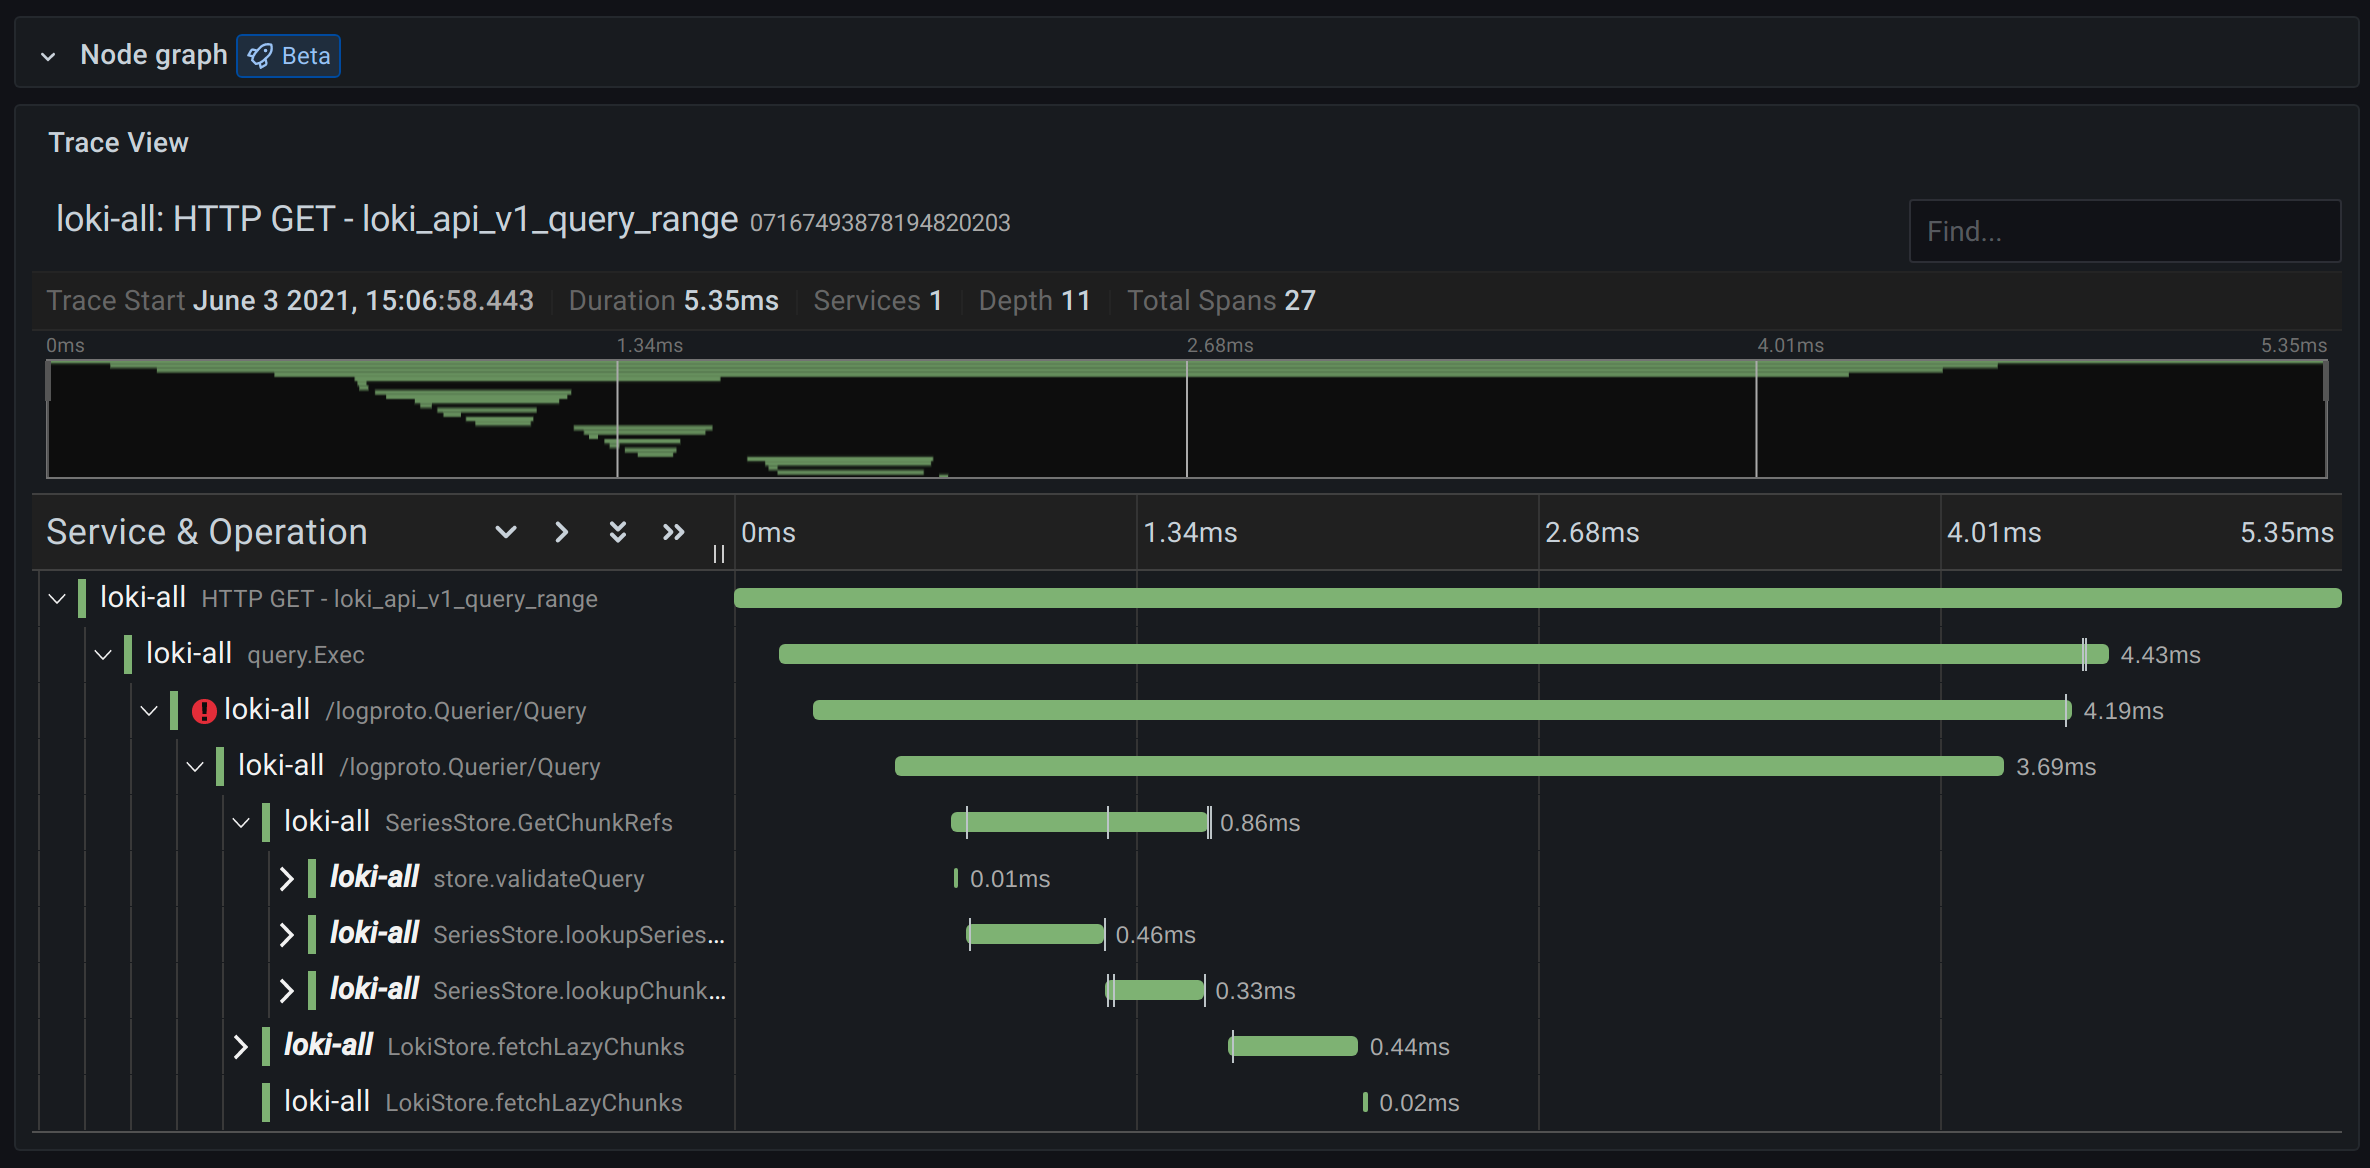
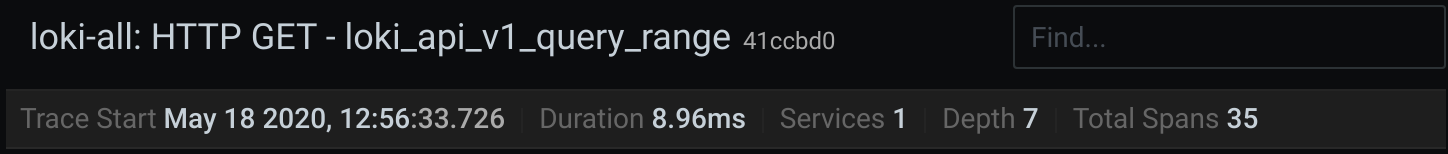
- Title. Displays the name and trace ID of the root span.
- Search. Highlight spans that contain search text.
- Metadata. Various metadata about tracking.
Minimap
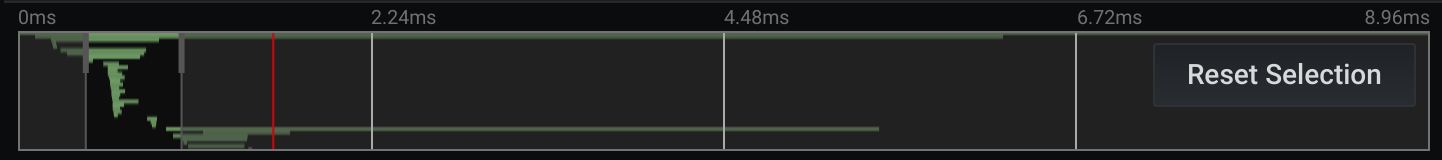
Display a condensed view or track timeline. Drag your mouse over the smallest map to zoom in to a smaller time range. Zooming will also update the main timeline, so it’s easy to see shorter time spans. When zooming in, hover over the smallest map and a reset selection button will appear to reset the zoom.
Timeline
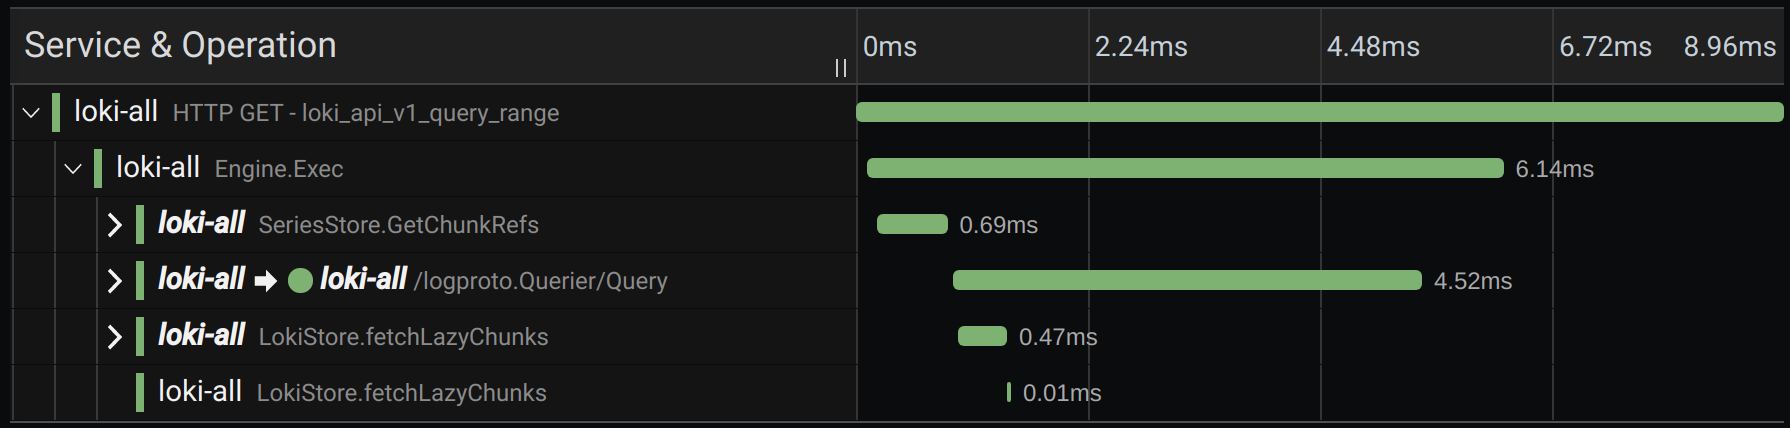
Displays a list of spans in trace. Each span line consists of these components.
- Expand the child span button. Expand or collapse all child spans of the selected span.
- Service Name: The name of the service that records the span.
- Operation Name: The name of the operation that the span represents.
- span duration bar. A visual representation of the duration of the operation in trace.
Click anywhere in the span row to display the details of the span.
Span details
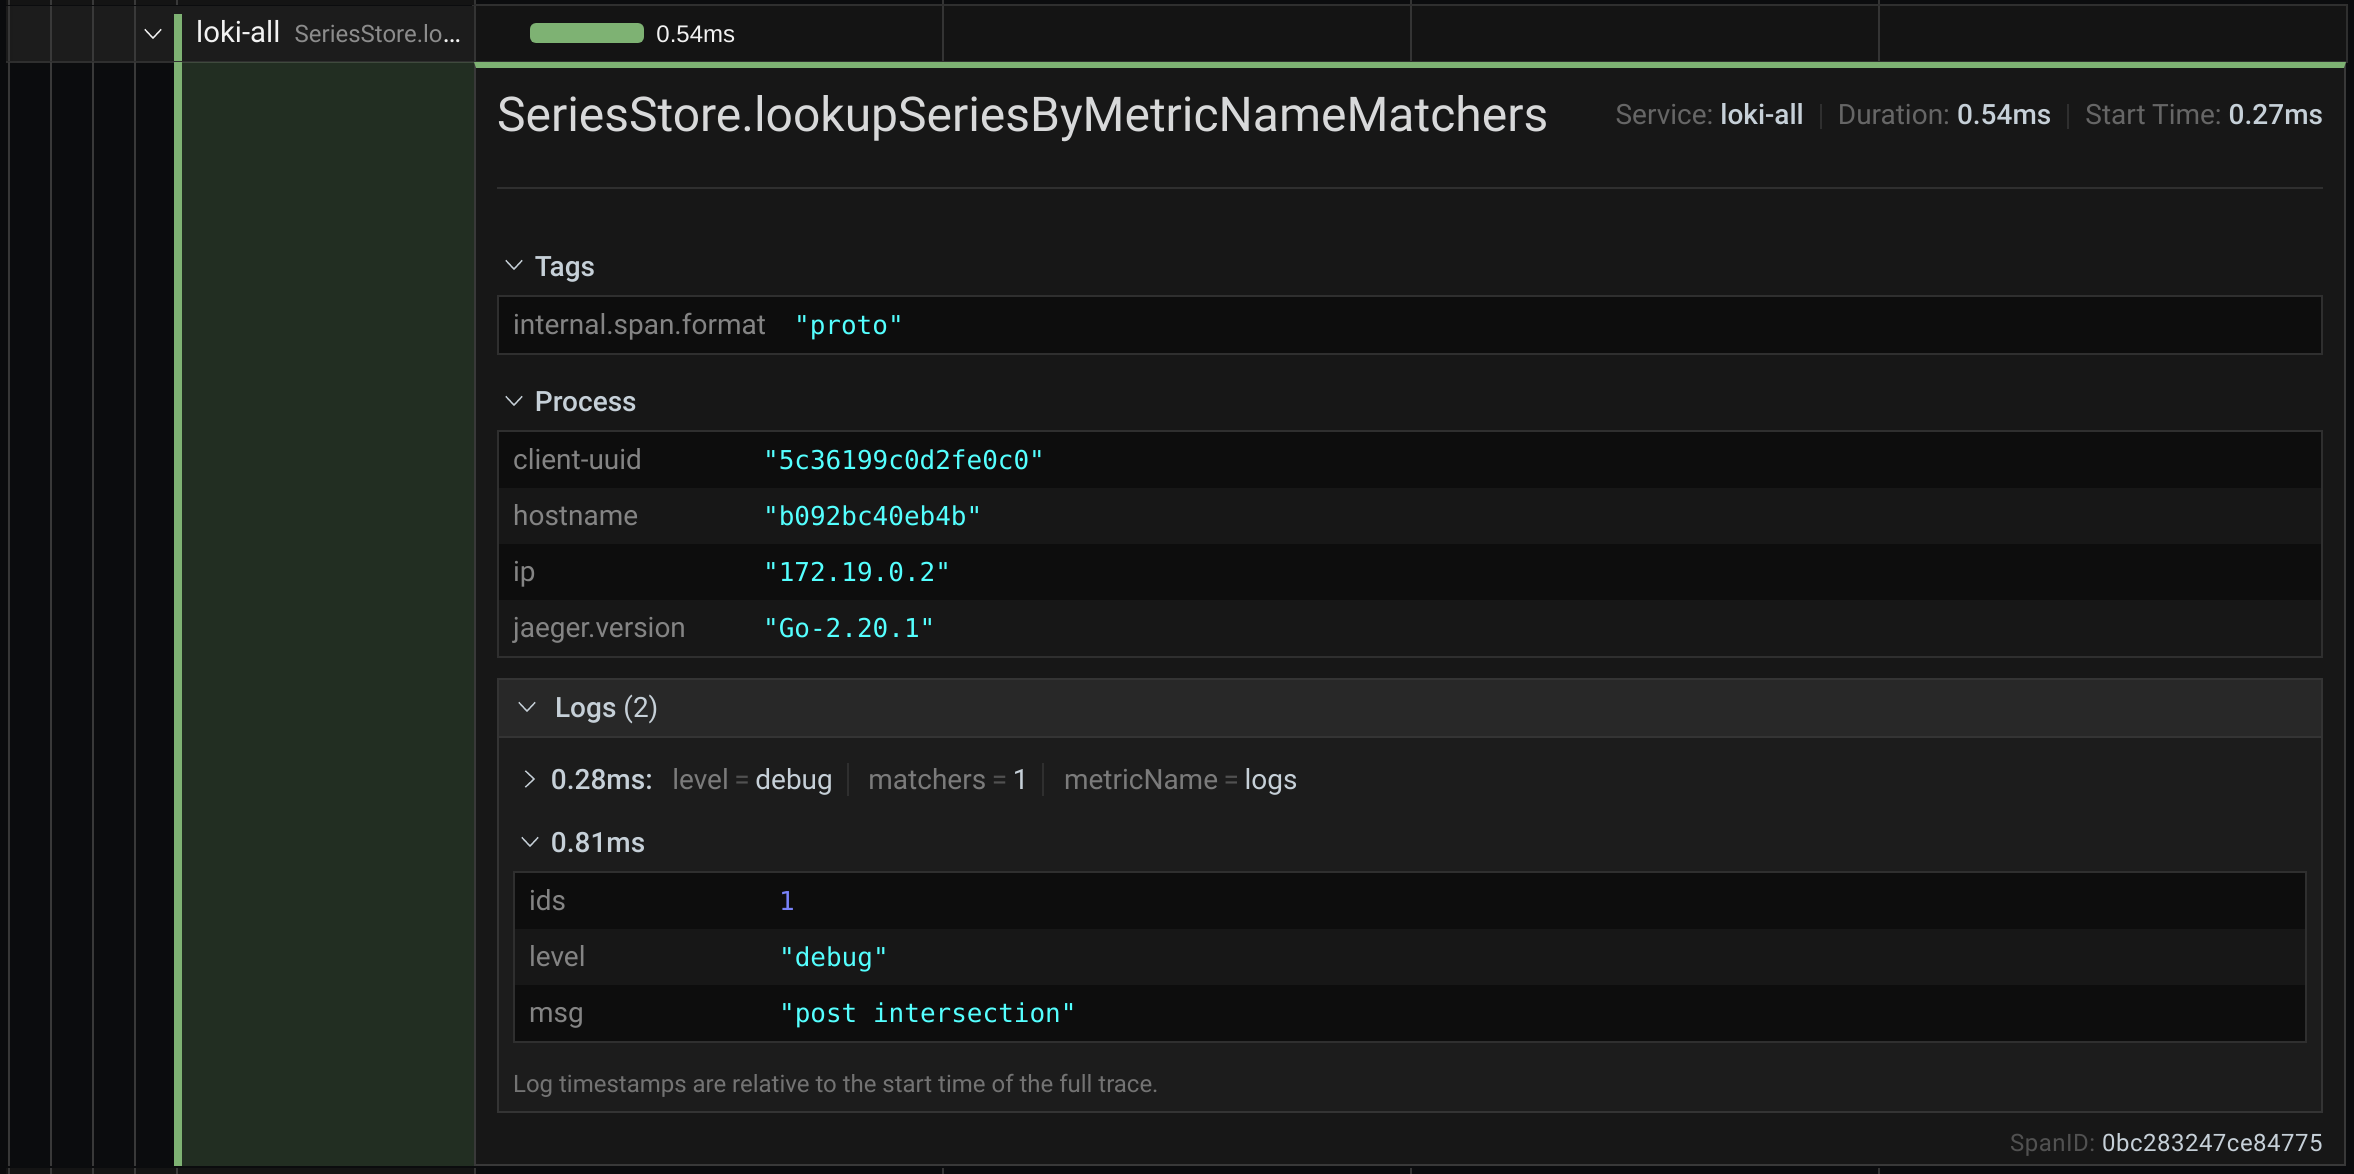
- The name of the operation
- span metadata
- Tags。 Any tags associated with this span.
- Process metadata. Metadata about the process that records this span.
- Log. A list of logs recorded by this span and associated key values. In the case of Zipkin logs, a comment for Zipkin is displayed.
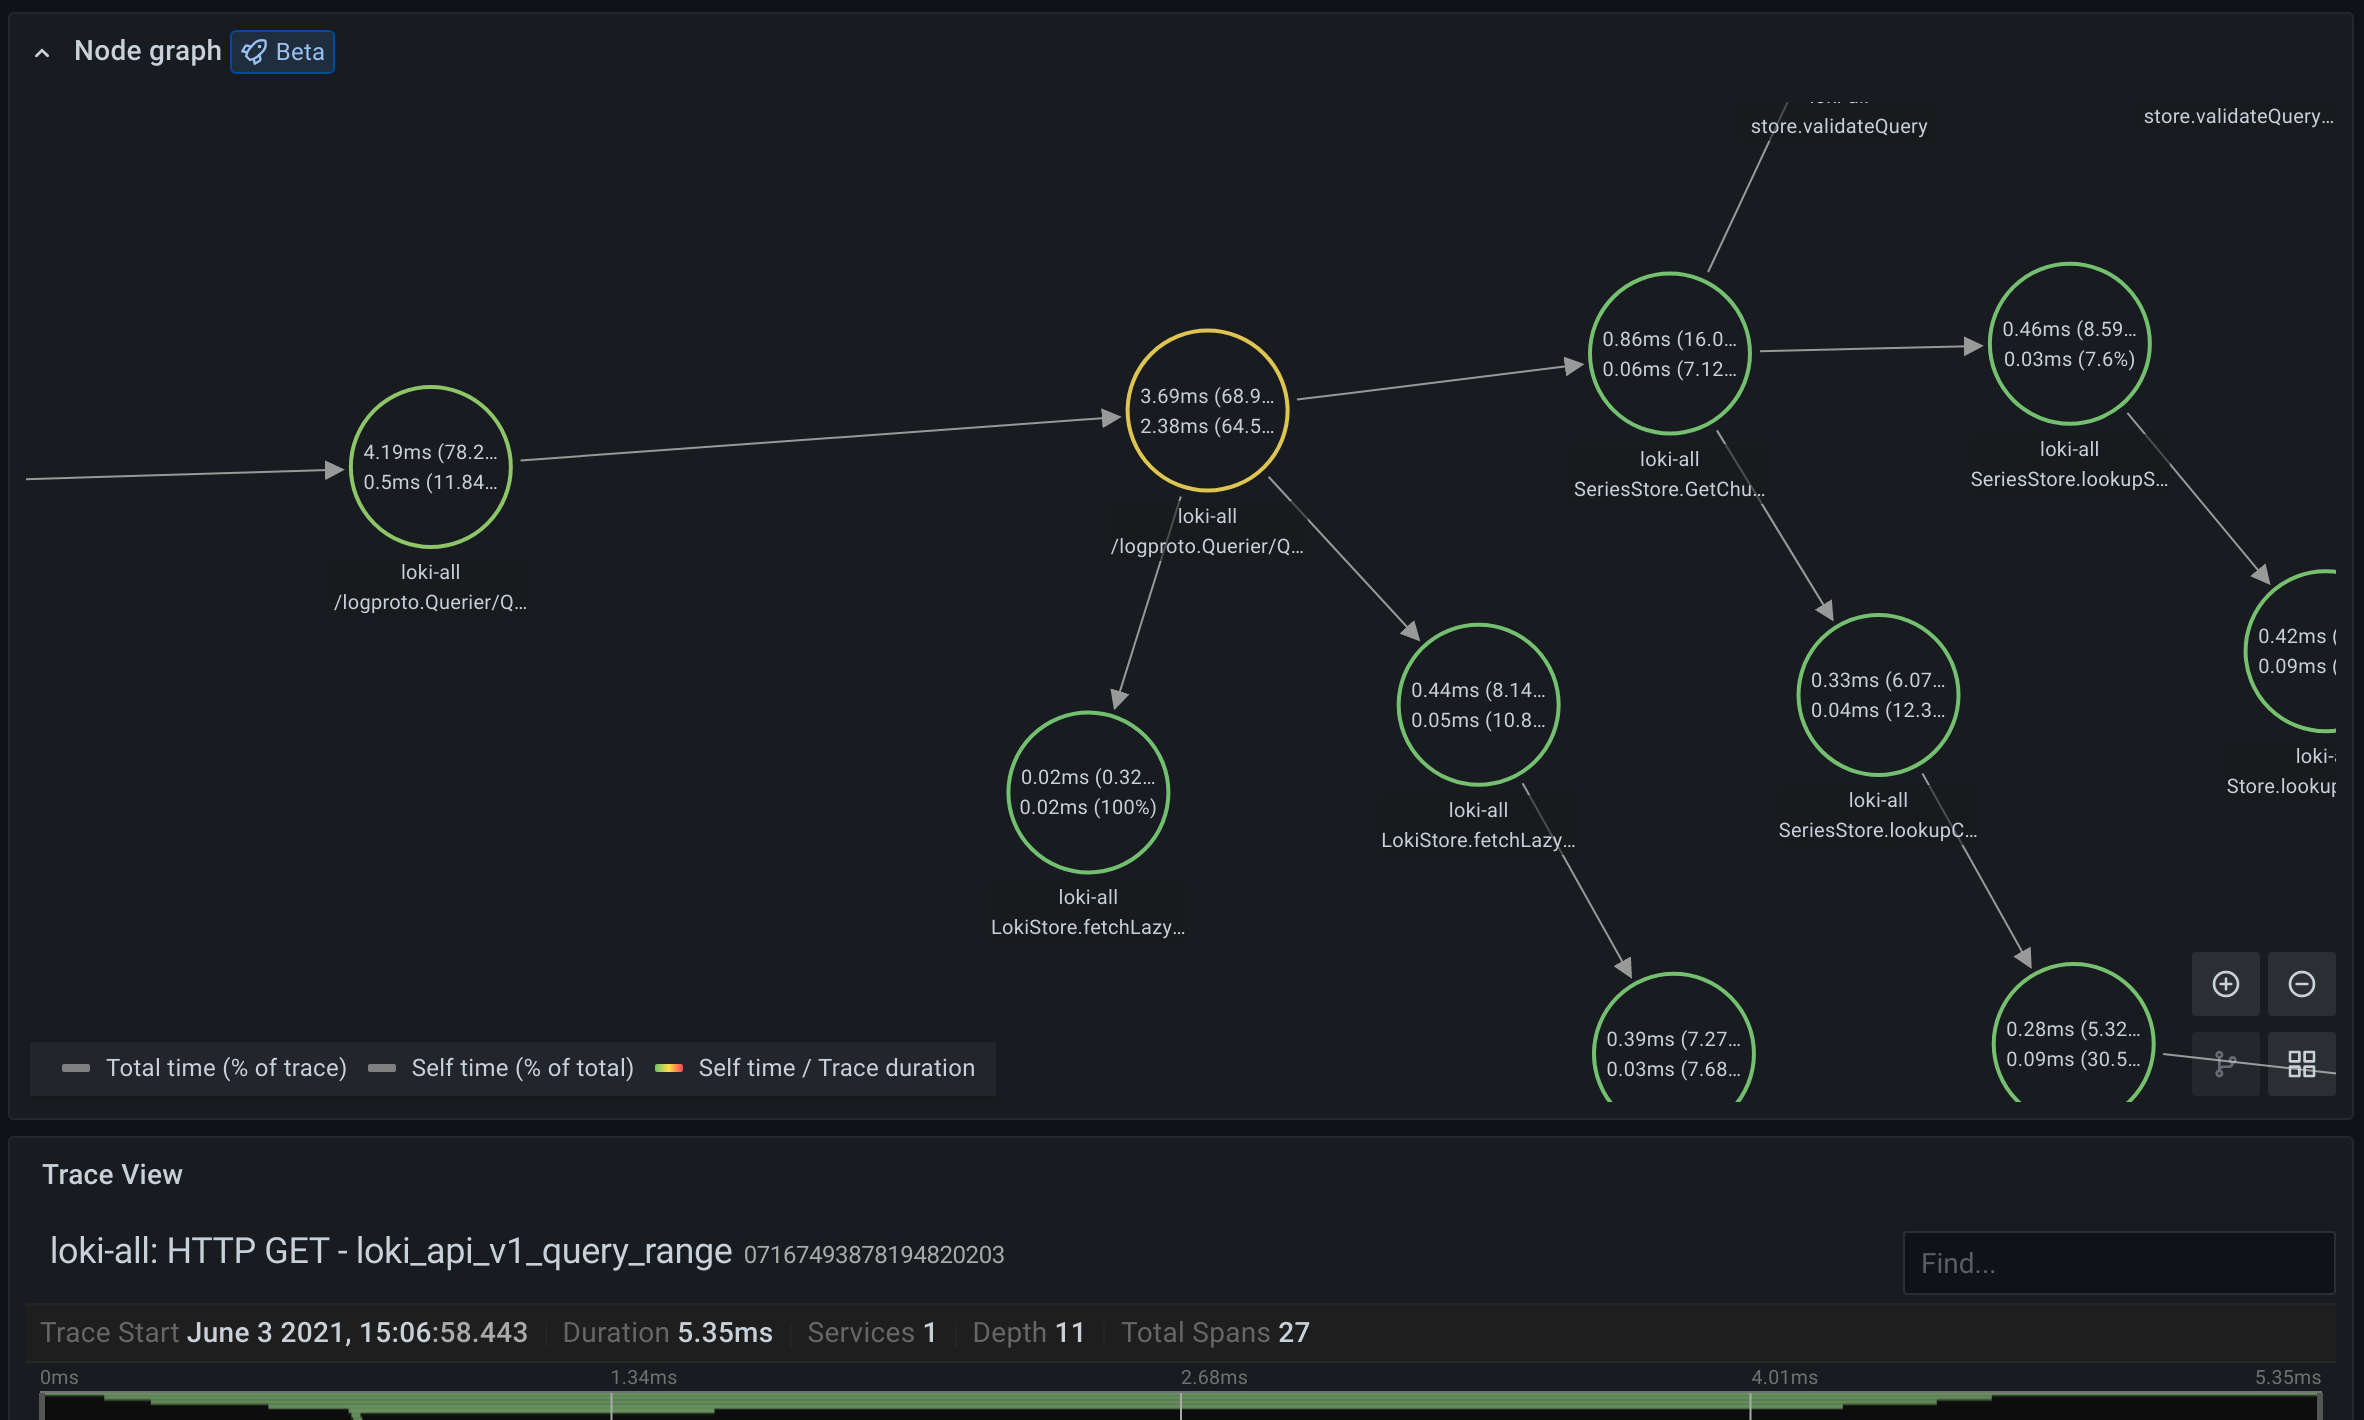
Node graph
You can choose to expand the node graph for the displayed trace. Depending on the data source, this can show the SPAN of the trace as a node in the graph, or show some additional context, such as a service graph based on the current trace.
Trace to logs
Note: Available in Grafana 7.4 and later.
You can navigate directly to the logs associated with that span from a span in the trace view. Currently, this is available for Tempo, Jaeger, and Zipkin data sources. Please refer to their documentation on how to configure this feature.
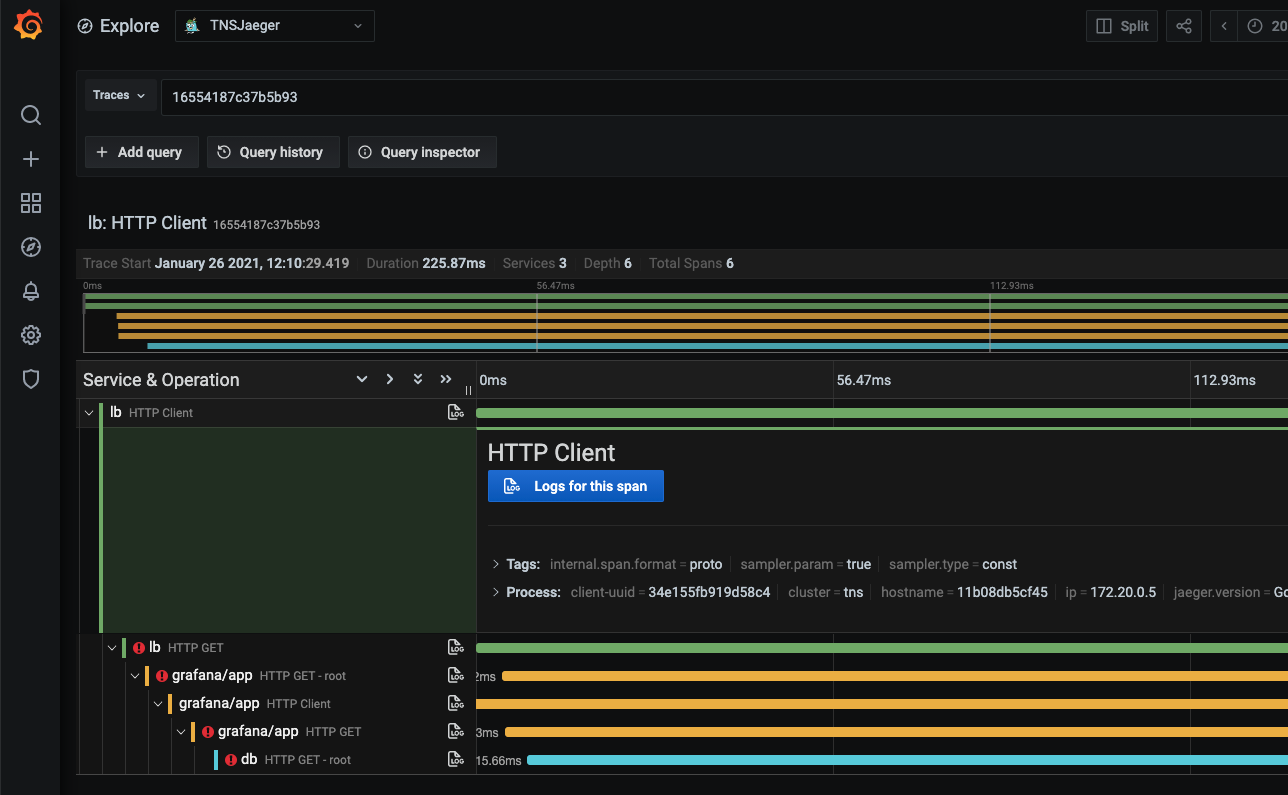
Click the document icon to open a split view with the configured data source in Explore and query the relevant logs of span.
Data API
This visualization needs to return a specific data structure from the data source in order to display it correctly.
The data source needs to return the data frame and set itframe.meta.preferredVisualisationType = 'trace'。.
Data frame structure
Required fields:
| Field name | Type | Description |
|---|---|---|
| traceID | string | The identifier of the entire trace. There should be only one trace in the data frame. |
| spanID | string | The identifier of the current span. SpanIDs should be unique within each trace. |
| parentSpanID | string | The SpanID of the parent span, which is used to create child span relationships in the trace view. For root spans that do not have a parent, this can be undefined。 |
| serviceName | string | The service name of this span. |
| serviceTags | TraceKeyValuePair[] | A list of tags related to the service. |
| startTime | number | The start time of the span, epoch time in milliseconds |
| duration | number | The duration of the span, in milliseconds. |
Optional field
| Field name | Type | Description |
|---|---|---|
| logs | TraceLog[] | List of logs related to the current span. |
| tags | TraceKeyValuePair[] | A list of tags related to the current span. |
| warnings | string[] | A list of warnings related to the current span. |
| stackTraces | string[] | A list of stack traces related to the current span. |
| errorIconColor | string | If span is marked as error: true, the color of the error icon. |
For more information about types, see TraceSpanRow、TraceKeyValuePair and TraceLog