Grafana Series (5): Grafana Explore Query Management
This article was last updated on: July 24, 2024 am
👉️URL: https://grafana.com/docs/grafana/latest/explore/query-management/
📝Description:
Query management in Explore To help debug queries, Explore allows you to investigate query requests and responses, as well as query statistics,…
Query management in Explore
To help debug queries, Explore allows you to investigate query requests and responses, as well as query statistics, through the Query Inspector. This feature is similar to the task of the Panel Inspector Check query performance and Examine query request and response data。

Query history
Query history is a list of queries you’ve used in Explore. History is in your browser and is not shared. To open and interact with your history, tap ExploreQuery historyButton.
View query history
Query history lets you view your query history. For each individual query, you can:
- Run a query.
- Create and/or edit a comment.
- Copy a query to the clipboard.
- Copy the short link of the query to the clipboard.
- Star the query
Manage your favorite queries
All queries that are flagged in the Query History tab appear in Tags. This gives you faster access to your favorite queries and the ability to reuse them without having to enter them from scratch.
Sort query history
By default, the query history shows the most recent queries. You can sort your history by date or by data source name in ascending or descending order.
- clickQuery sortedField.
- Select one of the following options:
- The latest in front
- The oldest is first
- Data sources A-Z
- Data source Z-A
Note: If you are in split mode, the sort mode selected only applies to the active panel.
Filter the query history
In the Query History and Star Rating tabs, filter the query history by data source name.
- clickFilter queries for specific data sourcesField.
- Select the data source for which you want to filter history. You can select multiple data sources.
atQuery historytab, you can also use the slider to filter queries by date.
- Use the vertical slider to filter the query for dates.
- Adjust the start date by dragging the top handle.
- Adjust the end date by dragging the top handle.
Note: If you are in split mode, the filter is only applied to your current active panel.
Search in the query history
You can search in your history queries and in your comments. In the Query History tab and the Star Rating tab, you can search for queries.
- clickSearch queriesColumn.
- Enter the term you want to search for in the search bar.
Query history settings
You can customize the query history in the Settings tab. The options are described in the following table.
| Settings | Default value |
|---|---|
| Grafana will save your query history for the time period 1 week | |
| Change the default activity label | Query history tab |
| Only queries | that are currently active in Explore are displayed True |
| Clean up query history | Permanently delete all stored queries. |
Note: The query history settings are global and apply to both panels in split mode.
Prometheus specific features
The first version of Explore had a query experience tailored for Prometheus. When a query is executed, it actually executes two queries, one for the normal Prometheus query for the chart and one for the instant query for the table. The instant query returns the last value for each time series, which shows a good summary of the data displayed in the chart.
Metrics Browser
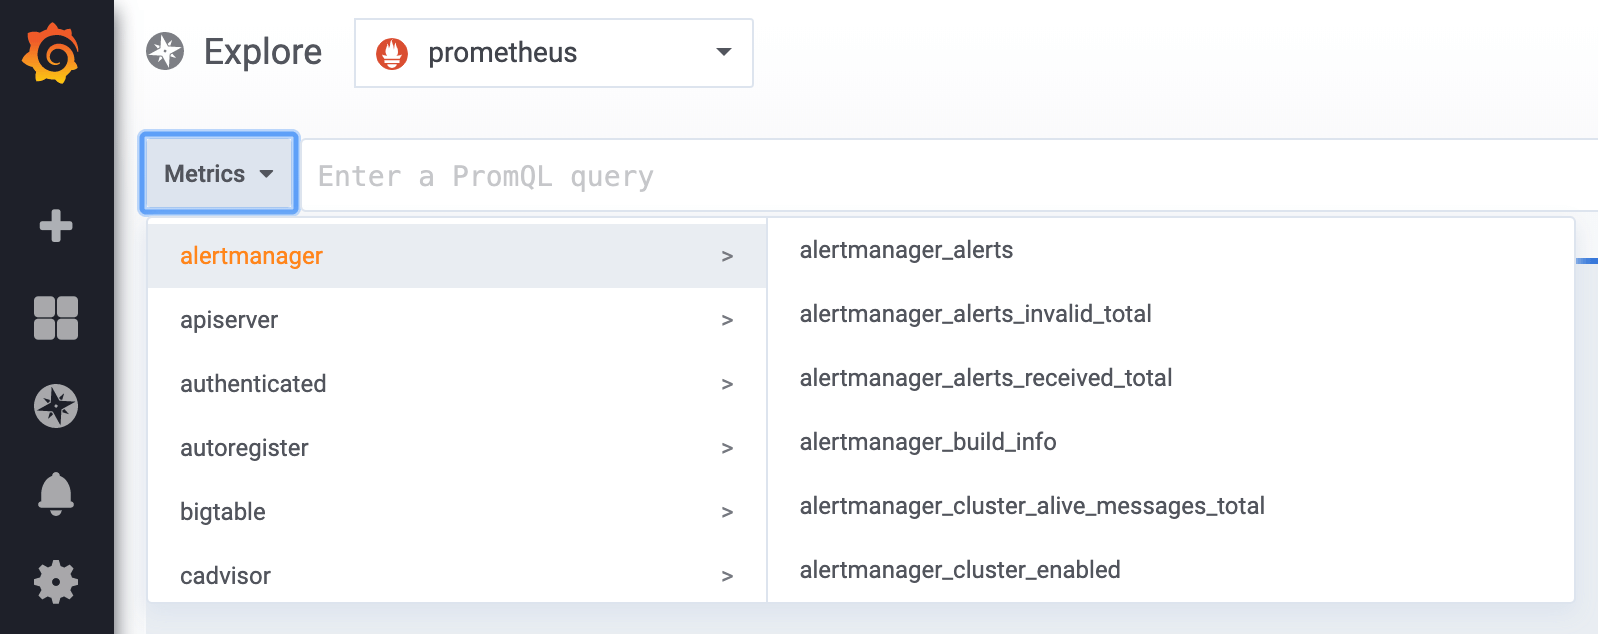
To the left of the query field, click Metricsto open the Metrics Browser. This shows a hierarchical menu with metrics grouped by their prefix. For example, all Alertmanager metrics are grouped intoalertmanagerPrefix. If you just want to explore which metrics are available, this is a good place to start.

Query fields
Query fields support metric names, automatic completion of functions, and work in much the same way as the standard Prometheus query editor. pressEnterYou can execute a query.
The autocomplete menu can be completed by pressingCtrl+Spaceto trigger. The autocomplete menu contains a new history section with a list of recently executed queries.
Suggestions can appear under the query field - click on them to update your query with suggested changes.
- For counters (monotonically growing metrics), a rate function is suggested.
- For buckets, the histogram function is recommended.
- For recording rules, you can extend the rules.
Table filtering
Click the Filter button in the Tags bar of the table panel to add a filter to the query expression. You can also add filters for multiple queries – filters are added to all queries.