Use Grafana to monitor the display - connect to Zabbix
This article was last updated on: February 7, 2024 pm
overview
In some cases, Metrics monitors the top 2 streams:
- Zabbix: Used for non-container virtual machine environments
- Prometheus: A cloud-native environment for containers
is coexisting. However, in this case, the unified monitoring display is not very convenient, and this article describes the use of Grafana docking Zabbix as a unified monitoring display. Let’s go!
Here, the main thing is used alexanderzobnin/grafana-zabbix Open source projects.
Grafana-Zabbix feature highlights
Grafana-Zabbix is a plugin for Grafana that allows visualizing monitoring data from Zabbix and creating dashboards for analyzing metrics and real-time monitoring. The main goal of the project is to extend Zabbix’s monitoring data visualization capabilities and provide a fast, powerful way to create dashboards.
Grafana combined with the Grafana-Zabbix plugin makes it possible to create awesome dashboards. Grafana-Zabbix has the following features:
- Rich drawing functions;
- Use Regex to select multiple indicators;
- Use template variables to create interactive and reusable dashboards;
- Displays events on graphs with annotations
- Transform and adjust data using metric processing functions (Average Avg, Median, Min Min, Max Max, Multiply Multiply, Summary Summarize, Timeshift Time shift, alias Alias Alias).
- Blend metrics from multiple data sources in the same dashboard or dashboard
- Create alarms in Grafana
- Use the Problems panel to display triggers
- Discover and share dashboards in the official library
Quick demo
Next we do a quick demo with all resources installed in K8s.
- (Prerequisite) Install K3s
- Install Grafana
- Install Zabbix
- Install the Grafana-Zabbix plugin on Grafana and enable it
- Configure DB data sources and Zabbix data sources on Grafana
- Import Zabbix dashboards on Grafana and see monitoring results
- Optionally, configure alarms on Grafana based on Zabbix metrics
Install K3s
1 | |
After the installation is complete, run the following command to view the running status:
1 | |
Install Grafana
Install using Helm:
1 | |
Here 2 parameters are added for subsequent convenience:
persistence.enabled=trueData is persisted and is not lost after restartingservice.type=NodePortEasy direct access to Grafana UI through NodePort
Install Zabbix
To save trouble, Zabbix is also installed directly in K3s.
However 🐾, note that often in production use scenarios, Zabbix is installed on a virtual machine environment, and Zabbix Proxy and Zabbix Agent are used to monitor areas not covered by Prometheus (typical examples: non-containerized physical machines, virtual machines; network equipment; databases, etc.)
Directly on the official Helm Chart Market - Artifact Hub Find an installation:
1 | |
This one aekondratiev/zabbix-server Helm Chart installs the following components:
- zabbix-server
- Along with zabbix-server, zabbix-agent runs as a sidecar
- zabbix-web
- postgresql
Configure DB data sources and Zabbix data sources on Grafana
Grafana-Zabbix’s database direct connection function
As a point of view, the Grafana-Zabbix plugin can query historical and trend data directly from the Zabbix database using MySQL, Postgres, or InfluxDB data sources. In order to execute a query, the plugin only needs to be pairedhistory、history_uint、trends and trends_uint Read access to the table. To make the connection more secure and prevent unnecessary data leakage, it is strongly recommended that only read access to the table be granted. But if you want to use this data source to query other data, you can grant SELECT permission to the entire zabbix database. In addition, all queries are invoked by the Grafana server, so you can limit connections to Grafana hosts only. Here is an example of MySQL:
1 | |
Configure the DB data source
In Grafana, in the Create Data Source option, select PostgreSQL The data source type and provide the database host address and port (the default is 5432)。 Fill in the database name (typically zabbix) and specify the credentials. As shown in the following figure:
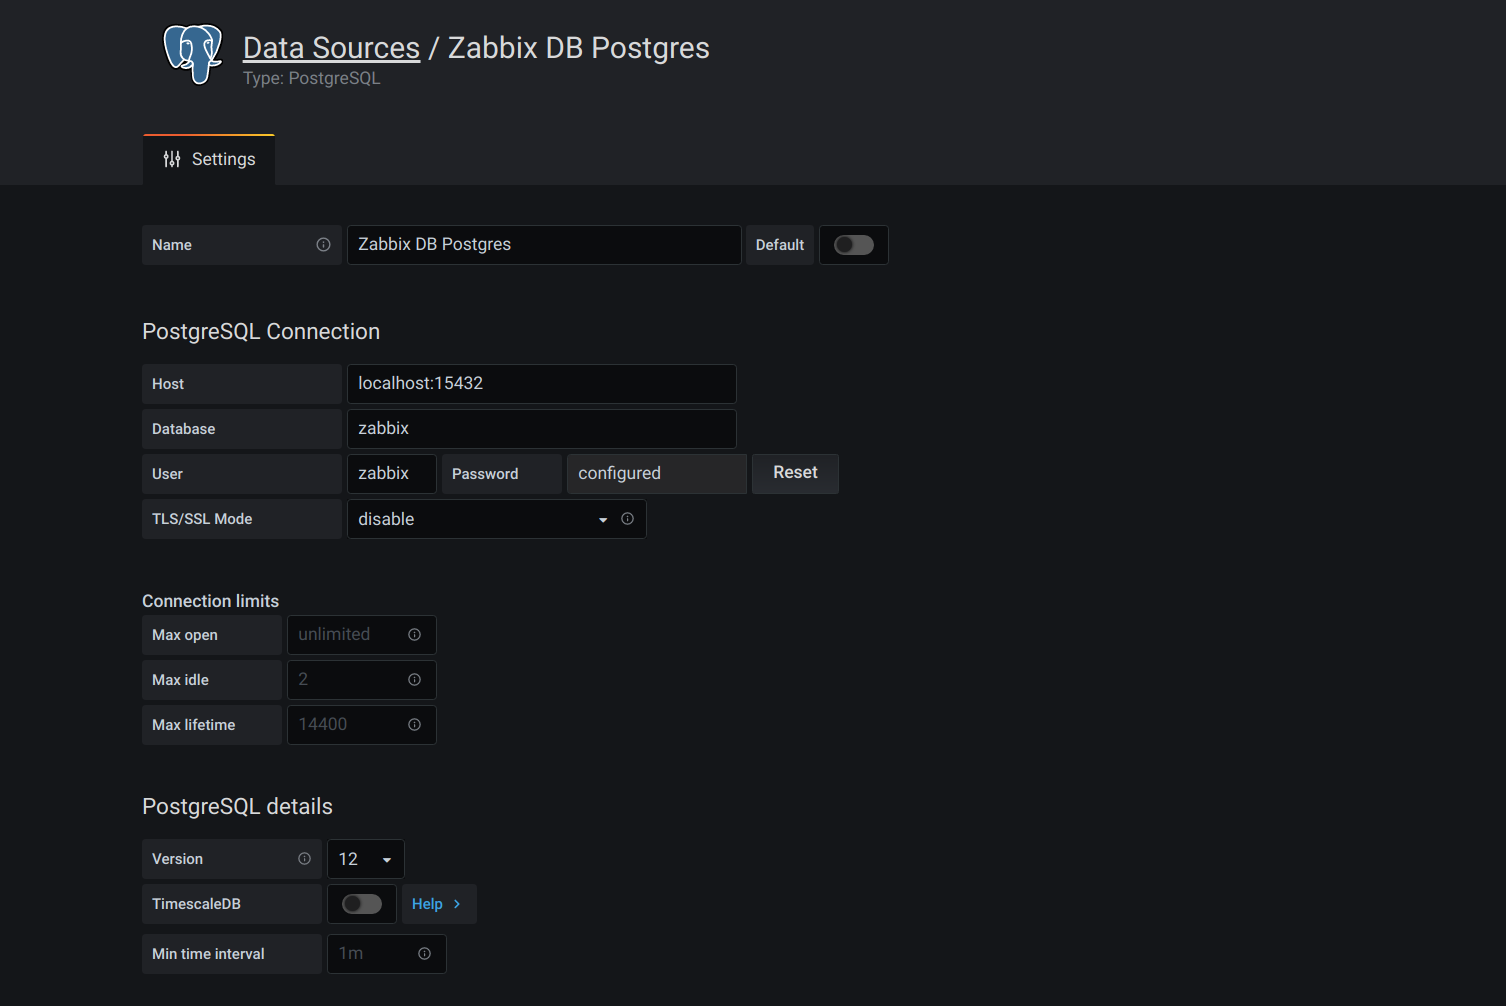
Why it is enabledDatabase direct connection, because if massive zabbix historical and trend data is queried through zabbix’s API, there will be certain problems with performance.
Install the Grafana-Zabbix plugin on Grafana and enable it
Go into the Grafana container and use grafana-cli Installation:
1 | |
🐾Warning:
Pass
grafana-cliAfter installing the plugin, you need to restart it to take effect, so you must configure itpersistence.enabled=true, otherwise the data will be lost after the restart, and the plugin will still not be installed.
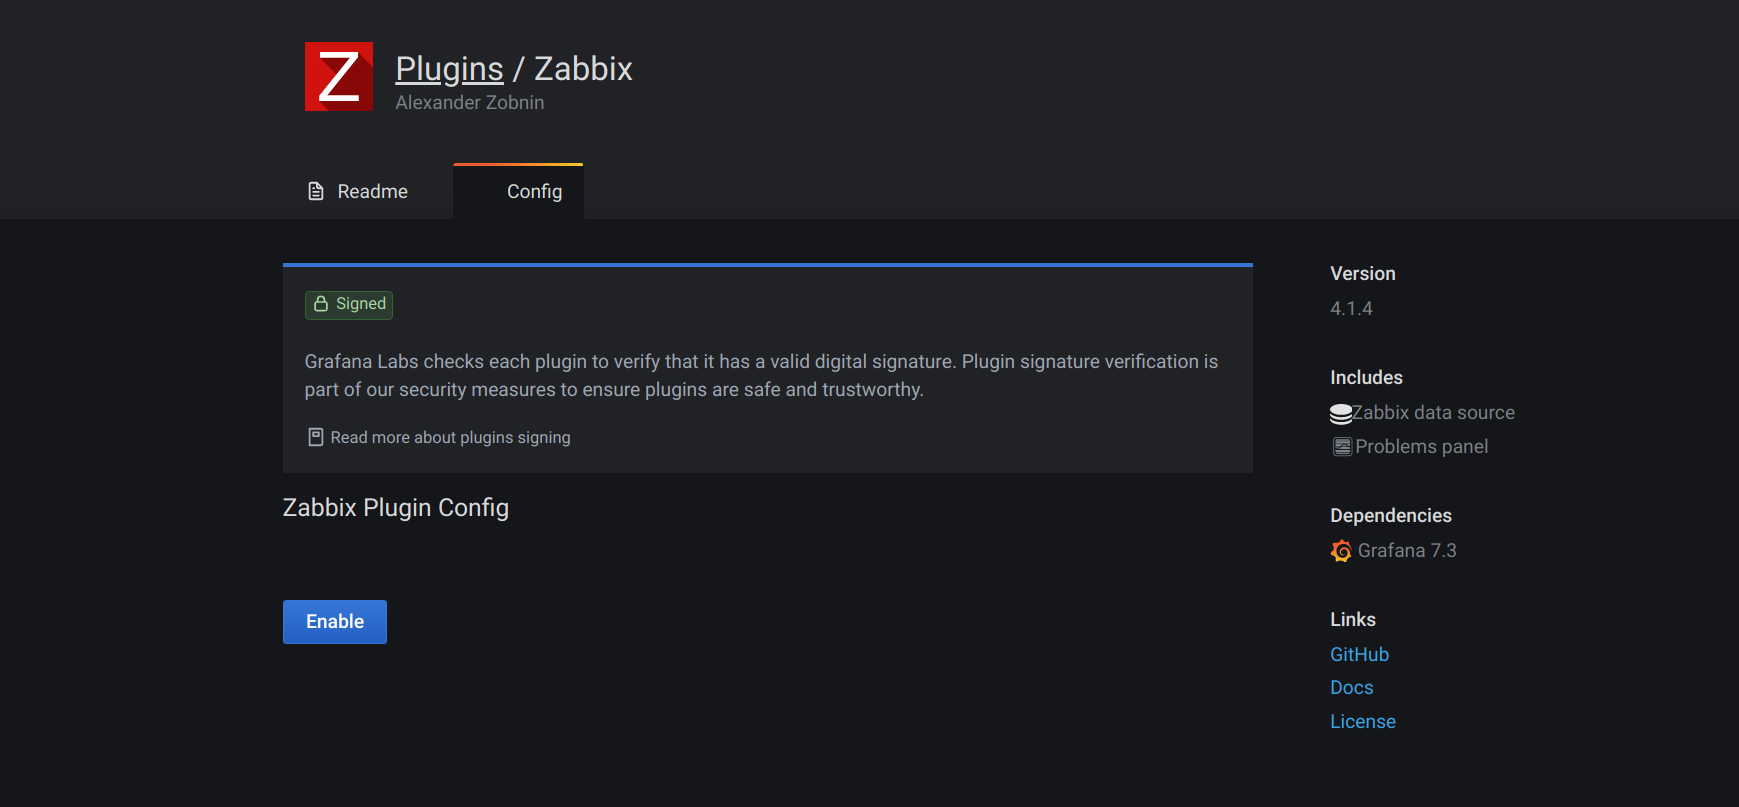
Once installed, you can enable the plugin.
Through Grafana’s Nodeport (e.g.:http://192.168.1.5:30000Access and log in to Grafana (📝 password in K8s Secret), go to the plugins interface of the Grafana side panel, and select Apps tab, and then select Zabbix Open it Config tab and enable the plugin. As shown in the following figure:
Configure the Zabbix data source
Once the plugin is enabled, you can add Zabbix data source.
To add a new Zabbix data source, click Add data source and select from the drop-down list Zabbix。 As shown in the following figure:
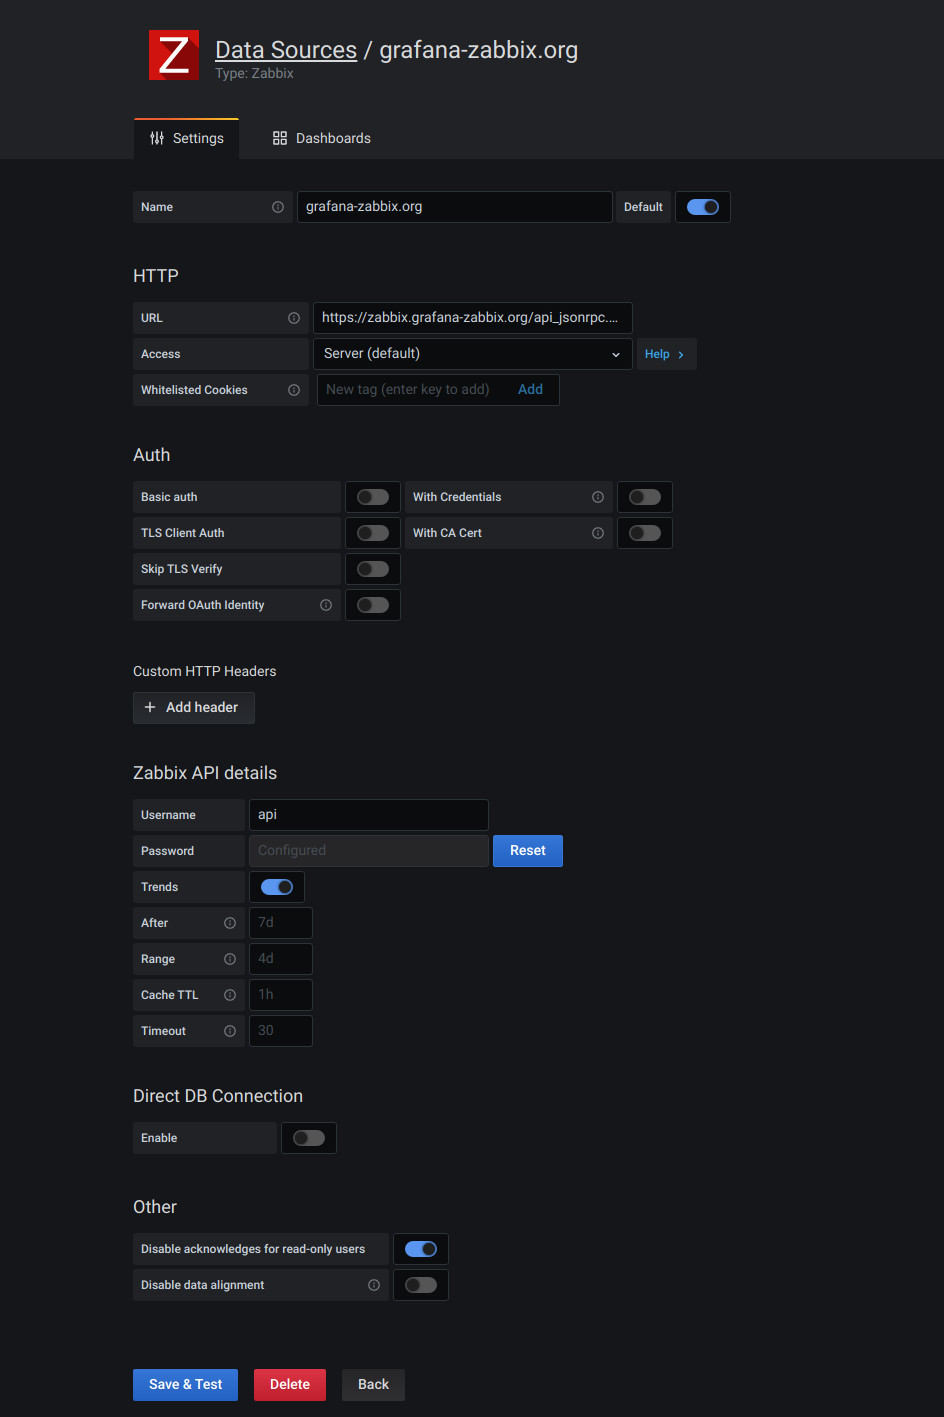
The key configuration items are as follows: (Others generally do not need to be moved)
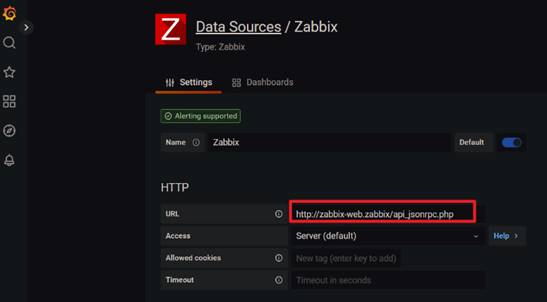
- HTTP
- URL: Zabbix API url, in general
/api_jsonrpc.php, as shown in Figure 1 above:http://zabbix-web.zabbix/api_jsonrpc.php
- URL: Zabbix API url, in general
- Zabbix API details
- Username and Password: The password of the account to log in to the Zabbix API. Remember to use sufficient permissions.
- Trends: If it is Zabbix 3.x and above, enable . This option is highly recommended when displaying long periods (more than a few days) because the project history of several days contains a large number of data points. Using trends will improve Grafana’s performance.
- Direct DB Connection
- Enable and select the Zabbix DB Data Source created above.
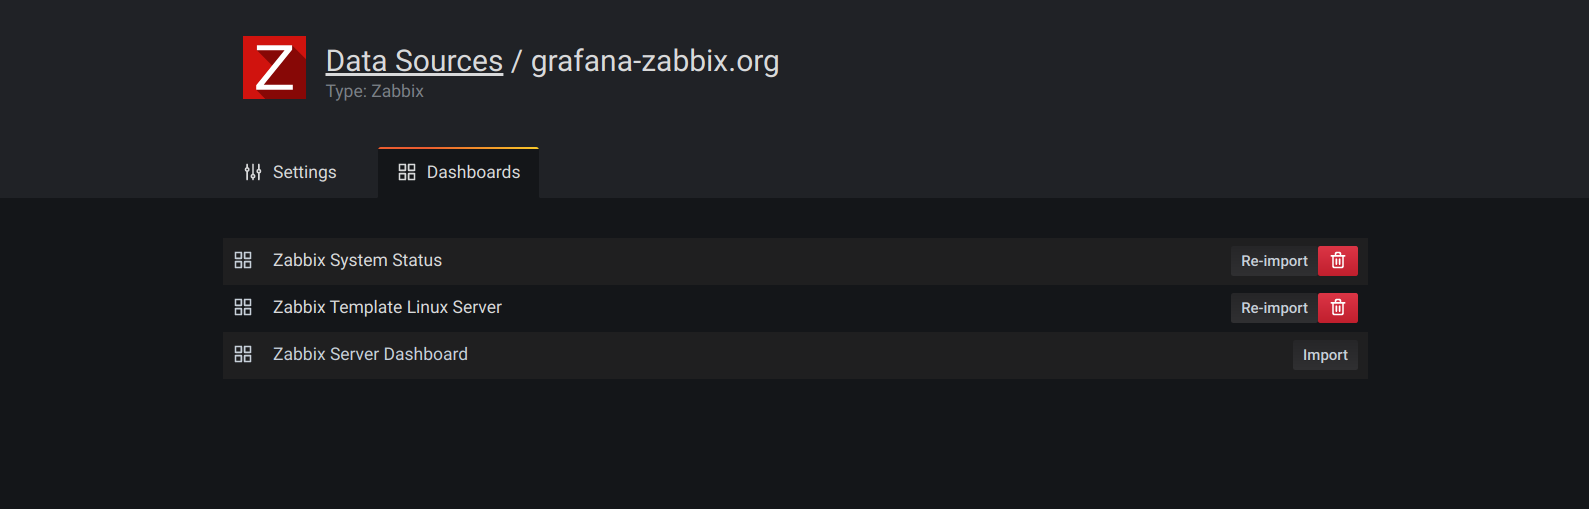
Import Zabbix dashboards on Grafana and see monitoring results
After that, import several Zabbix dashboards that come with it:
Then you can see the effect:
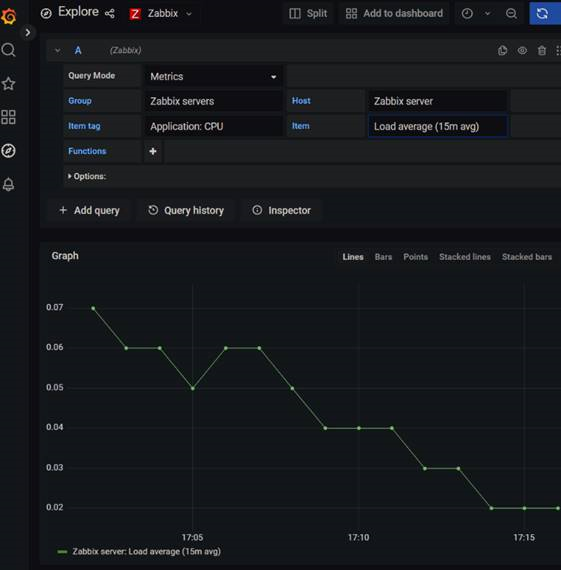
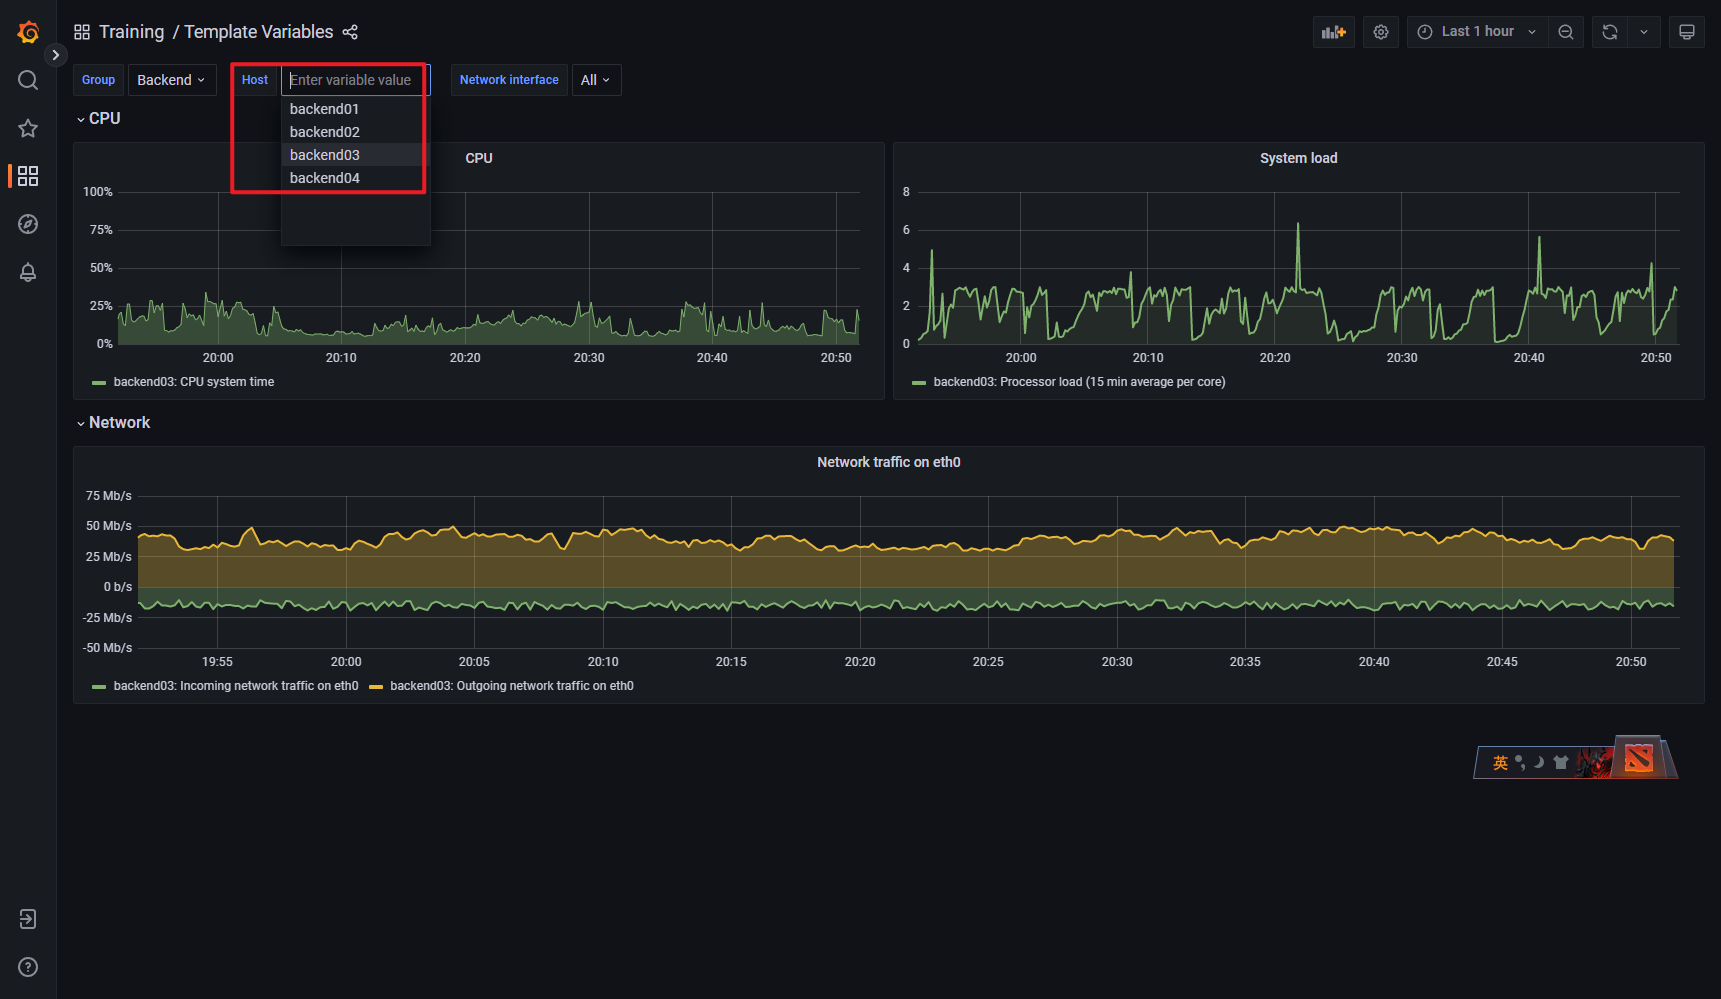
As shown above, Grafana supports flexible expression configuration for the Zabbix dashboard:
- Query Mode
- Group
- Host
- item tag
- Item: An expression for aggregation
- Functions
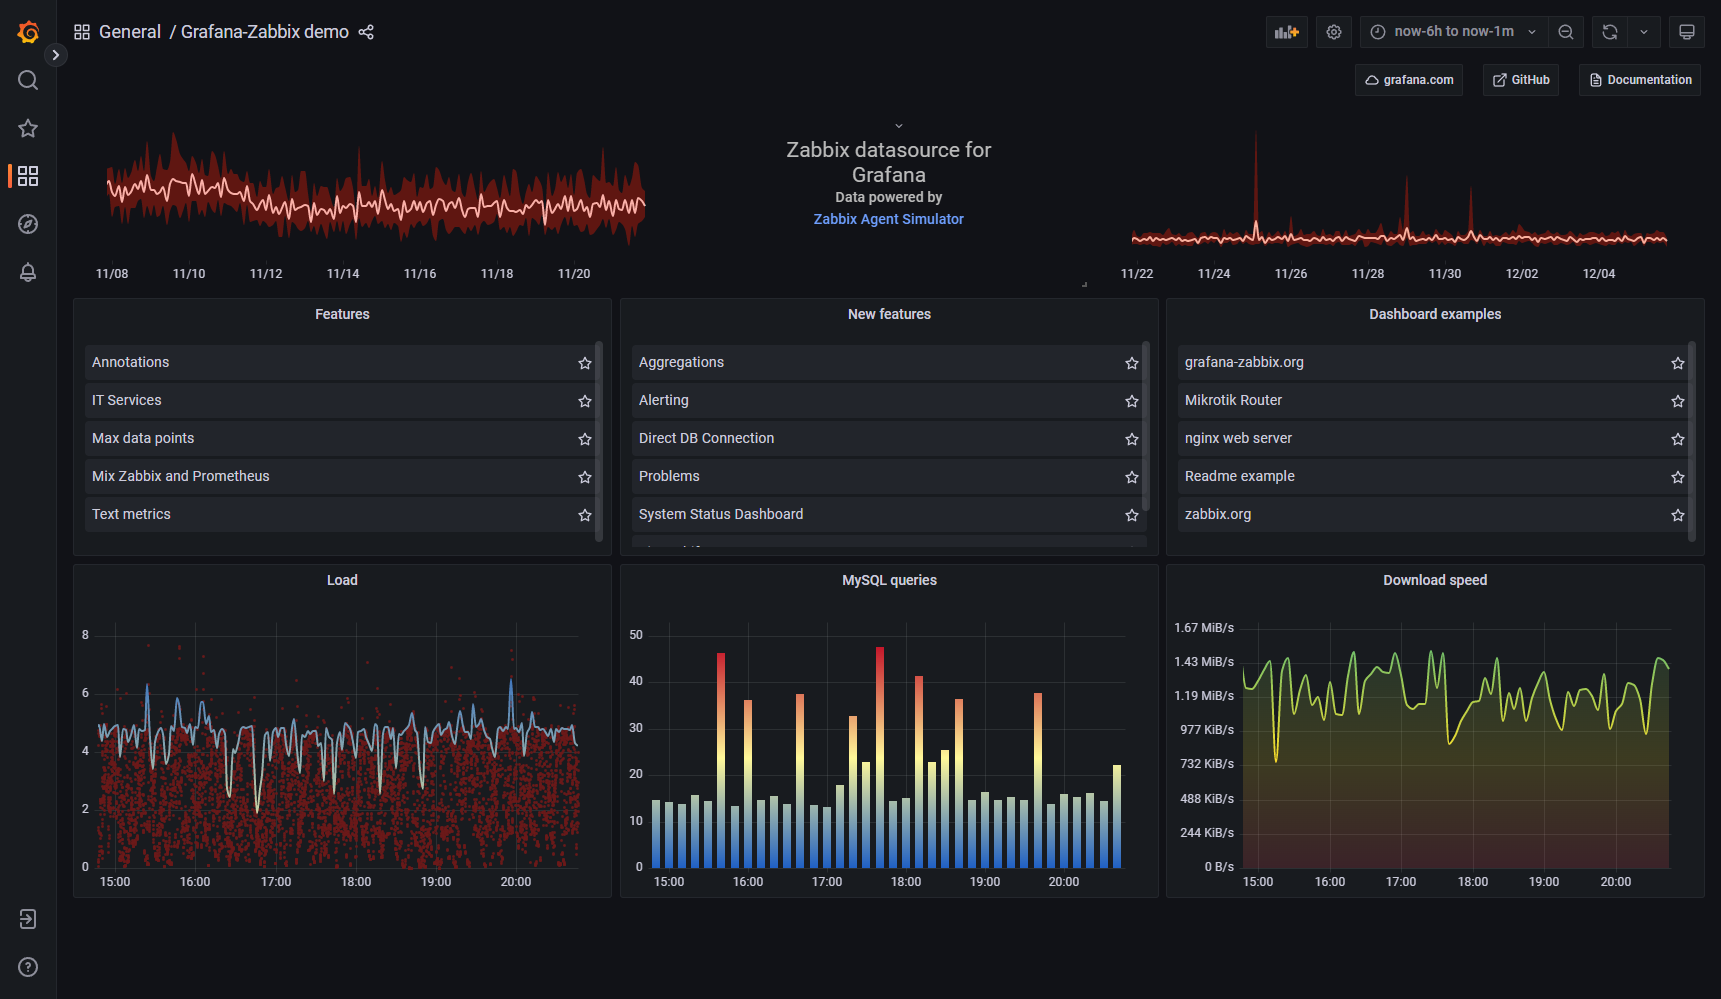
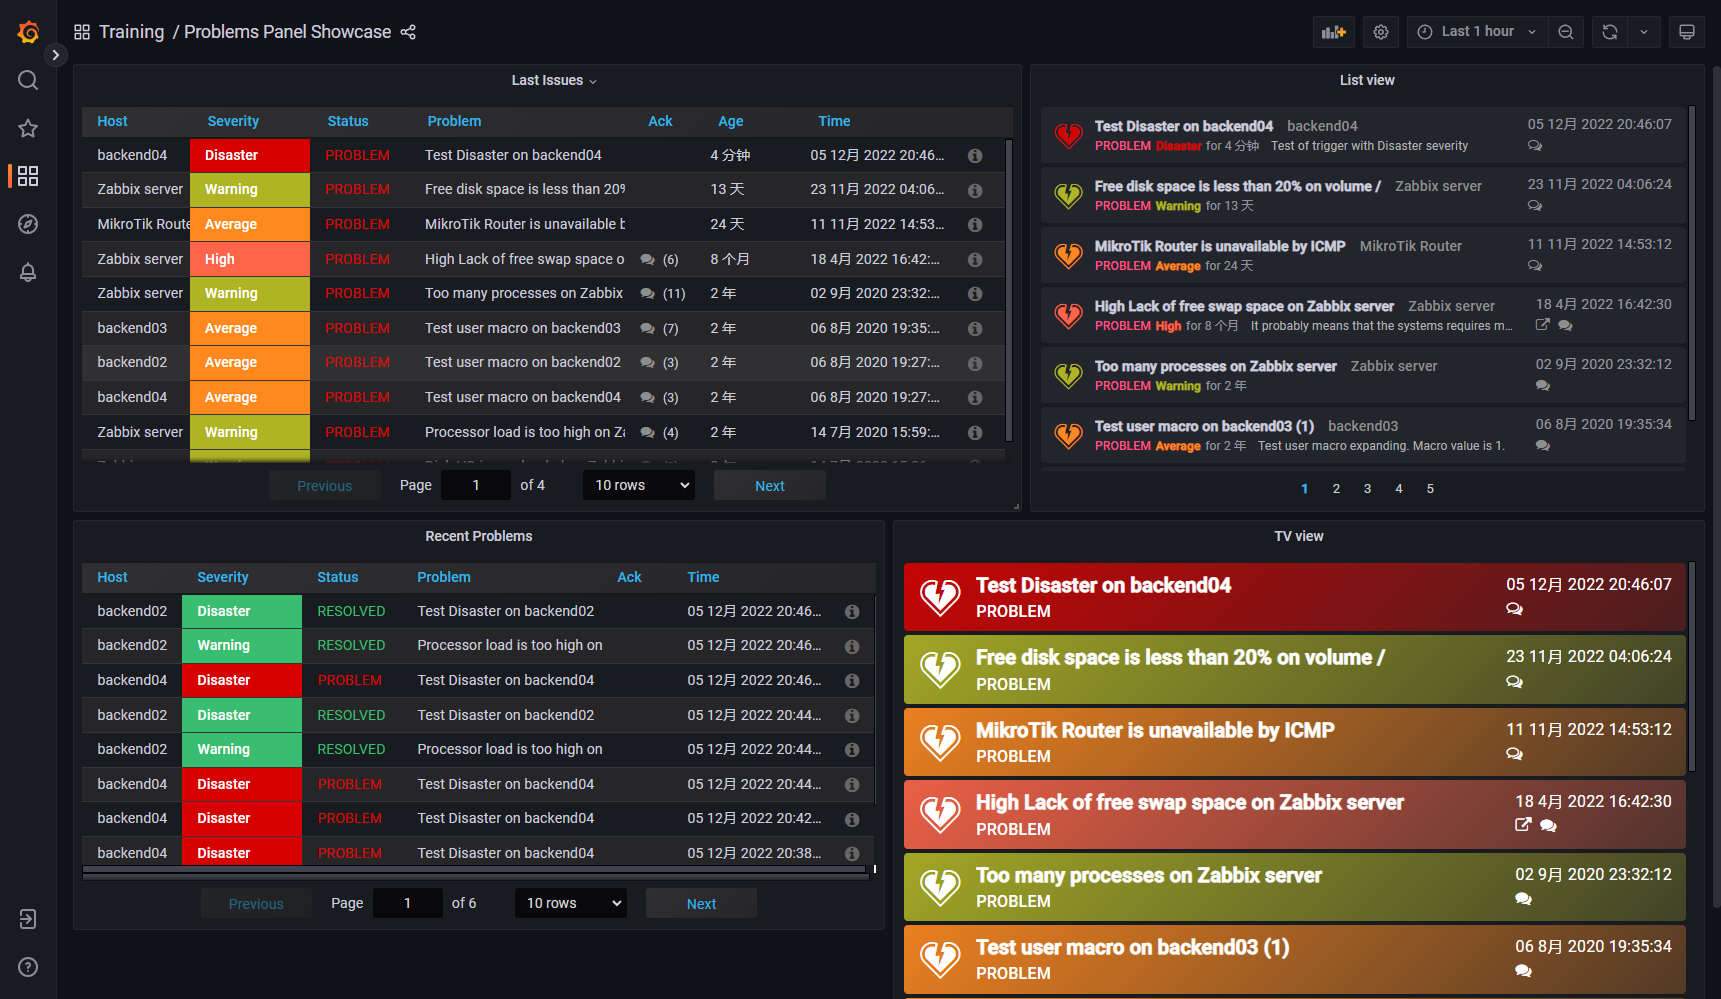
Don’t worry about some of the most complex dashboards on Zabbix not being reproduced on Grafana.
Here are some official demos:
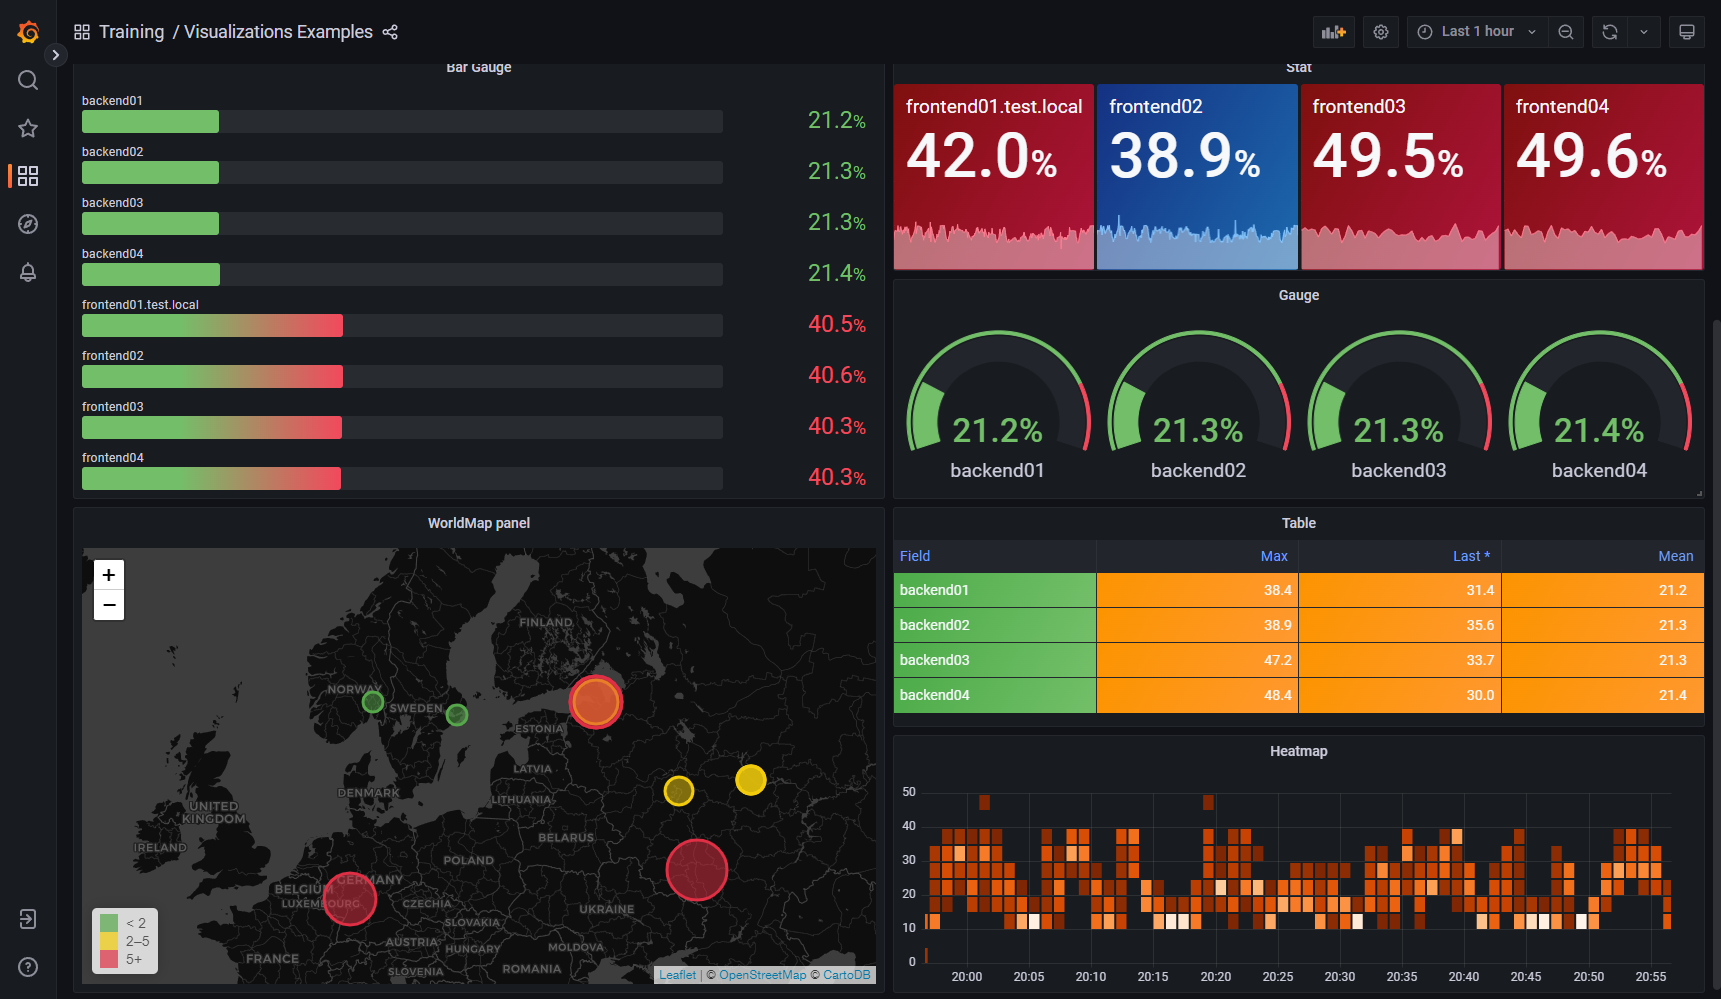
Configure alarms on Grafana based on Zabbix metrics
Click the sidebar Alerting, you can create Zabbix-based alarms, or you can directly edit the alert of the panel on the dashboard to configure, the effect after configuration is as follows:
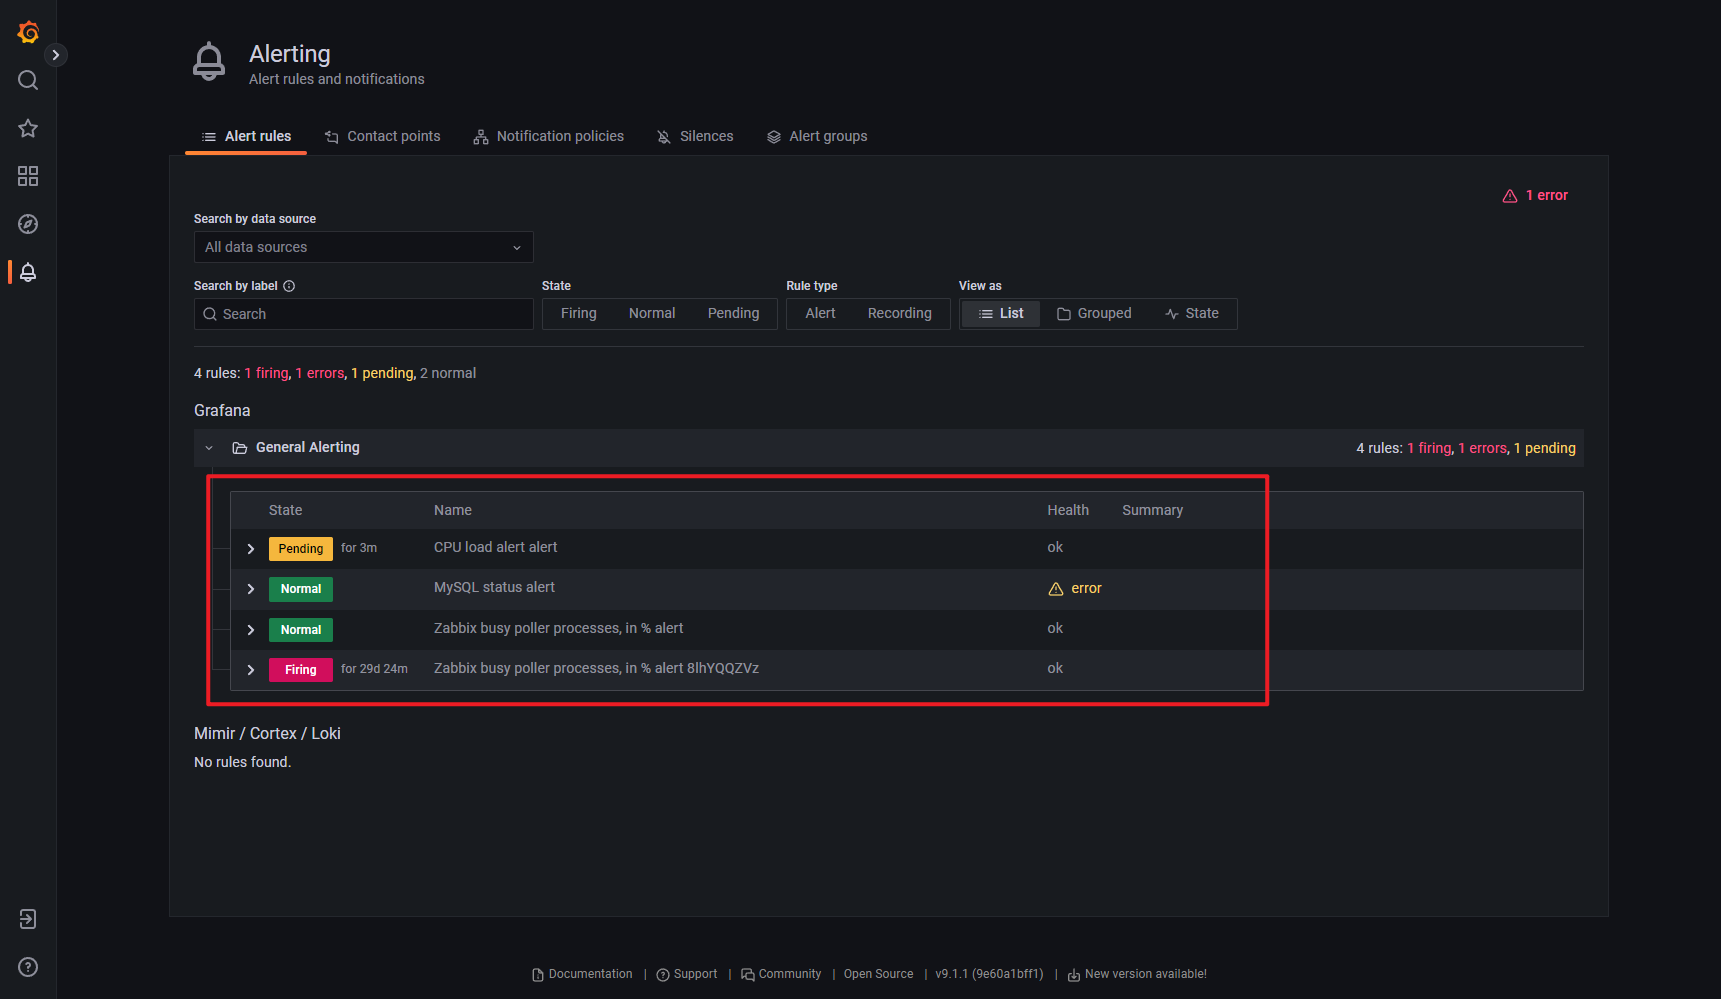
The above is the whole process of this demonstration, if you are interested, you can try to reproduce it yourself.
🎉🎉🎉
summary
In this article, we describe the following with Grafana + plugin: Grafana-Zabbix:
- Grafana is responsible for displaying and even alerting
- Zabbix serves as one of Grafana’s data sources.
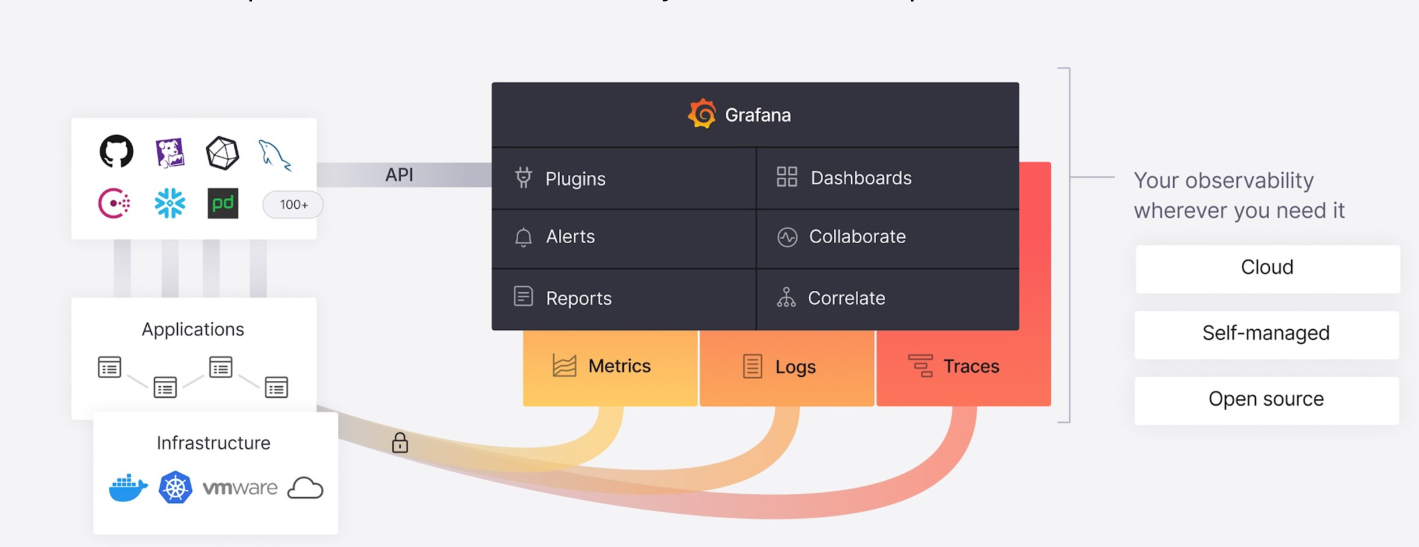
Going a step further, our environment may not only have 2 data sources, Zabbix and Prometheus, but even have:
- Metrics
- AWS CloudWatch
- …
- Logging
- Tracing
In this case, all these monitoring are regarded as Grafana’s data sources to achieve unified display and linkage of monitoring data:
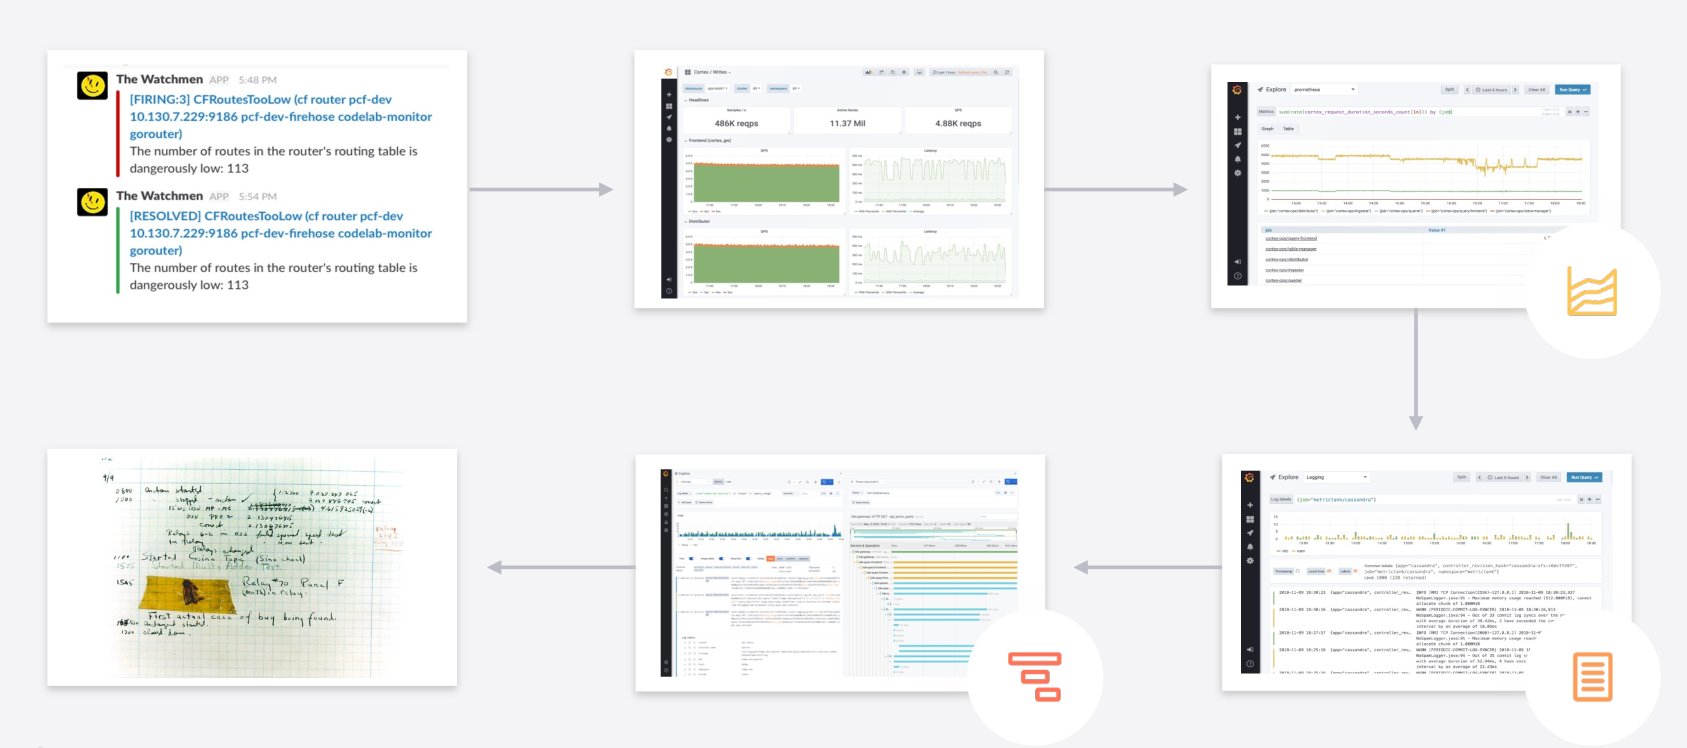
Linkage:
- Receive an alert from Grafana on Slack
- Click on the link or dashboard to jump to Grafana’s corresponding dashboard
- Check out the metrics on Grafana
- Jump to the log on Grafana to the point in time of the Metrics anomaly
- Jump to the Logs exception trace on Grafana
- Discover and code on the IDE to resolve issues
I can only say that Grafana paints a rather wonderful scene for us, and the future is promising. 👍️👍️👍️